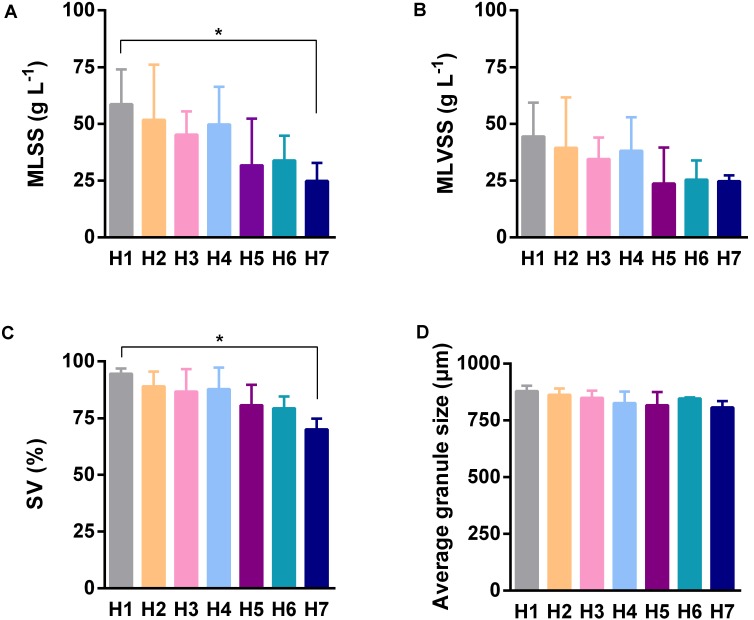
FIGURE 3.
Characteristics of AGS of different sampling heights. (A) The mixed liquid suspended solids of sludge. (B) The mixed liquor volatile suspended solids of sludge (biomass). (C) The percentage of sludge volume. (D) The average diameter of granule. Error bar was SD obtained based on the five times sampling data, ANOVA of Kruskal–Wallis test was used to analyze variation between different sampling heights, ∗P < 0.05.

