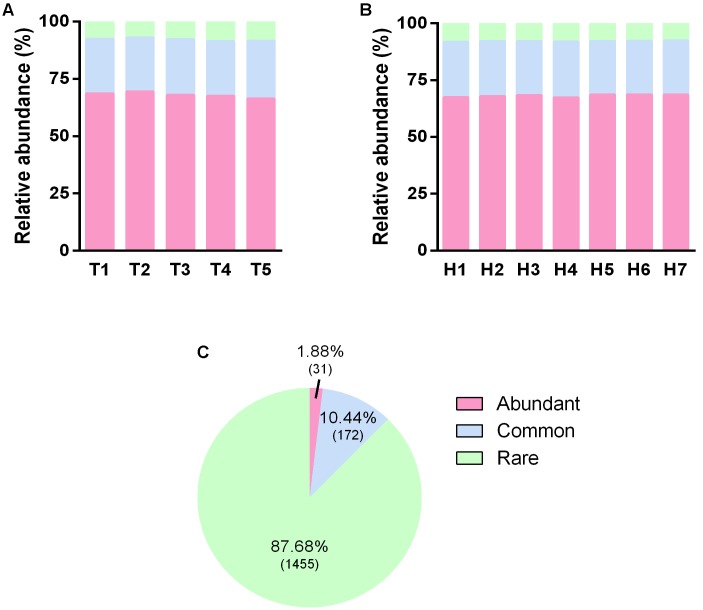
FIGURE 5.
Distribution of OTUs with different occurrence frequency. (A) Relative abundance of OTUs with different occurrence frequency in five sampling time points. (B) Relative abundance of OTUs with different occurrence frequency in seven sampling heights. (C) The percentage of OTUs number with different occurrence frequency, the according numbers of OTUs were presented in the brackets.

