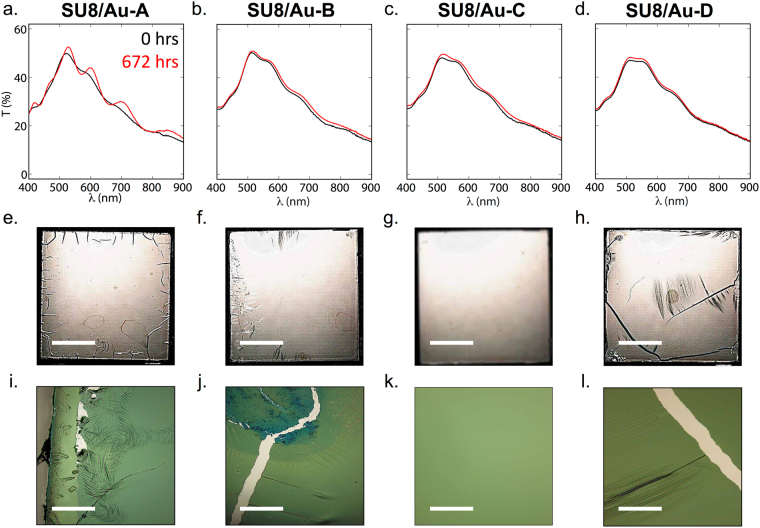
Figure 6.
Optical characterization of SU8/Au films prepared by following protocols A to D in Fig. 3: (a–d) plots of transmittance versus wavelength before (t = 0 hr) and after (t = 672 hr) immersion in cell culture medium, showing substantial changes for SU8/Au-A but comparatively small changes for the other films; (e–h) micrograph images of entire samples before and after immersion, showing significant cracking after immersion in all films except SU8/Au-C. Scale bars denote 10 mm. (i–l) micrograph images before and after immersion, showing significant cracking after immersion in all films except SU8/Au-C. Scale bars denote 50 μm.

