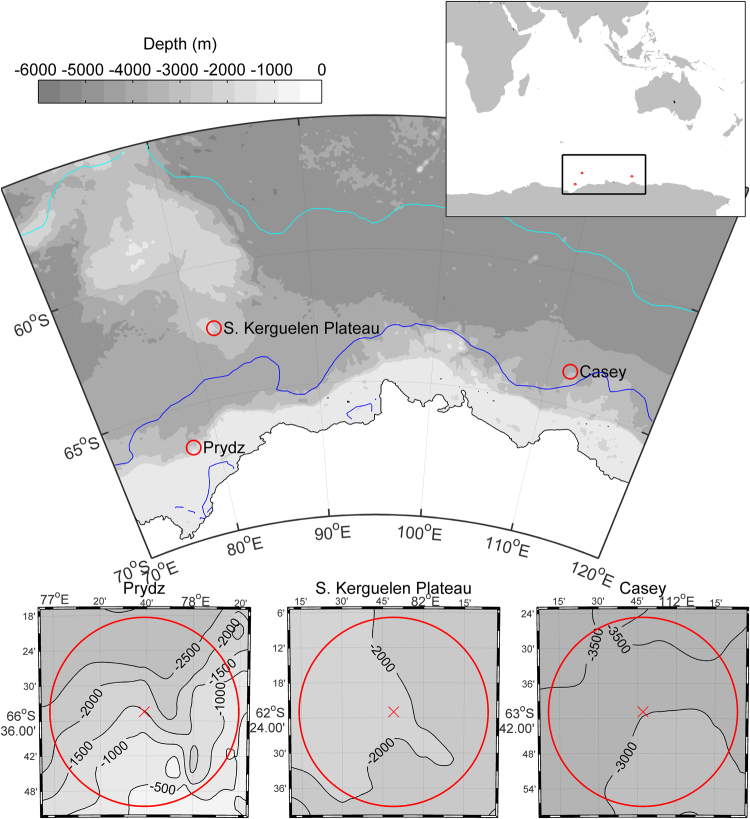
Figure 1.
Map of location of long-term recording sites used in this study. Crosses mark the nominal deployment location. Red circles indicate a 30 km radius around each recording site. The edge of the sea ice for 2014 is plotted for February 01 (dark blue line) and September 01 (light blue line) to provide an indication of summer minimum and winter maximum sea-ice extent. Map created using M_Map version 1.4 h and ETOPO 1 bathymetry/altimetry77 (https://www.eoas.ubc.ca/~rich/map.html). Sea ice edge was extracted from data the National Snow and Ice Data Center78 using the Matlab package Antarctic Mapping Tools79.

