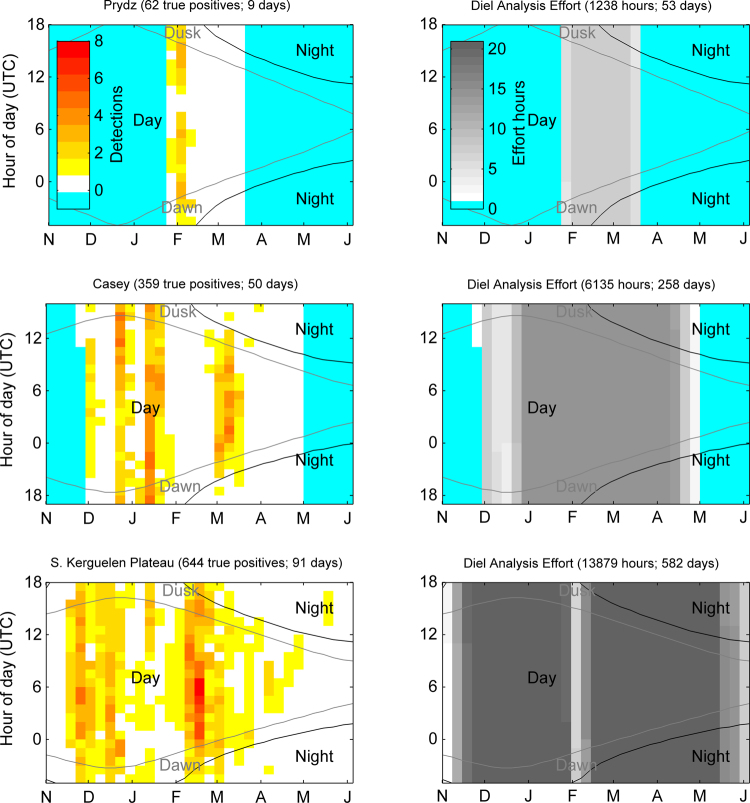
Figure 4.
Detections of sperm whales (left column) and hours of effort used for the diel analysis (right column) as a function of day of year and hour of day for each site. In this 2D histogram, all years of data have been aggregated into 7-day time bins. The Dawn and Dusk labels indicate periods of nautical twilight. Blue shading indicates time periods that were not included in the diel analysis from either lack of recordings (Nov-Jan at Prydz) or ice exclusions (all other excluded months). Months June through October are neither shown nor included in the diel analysis since no detections of sperm whales were made and the sites were fully ice covered during these months.

