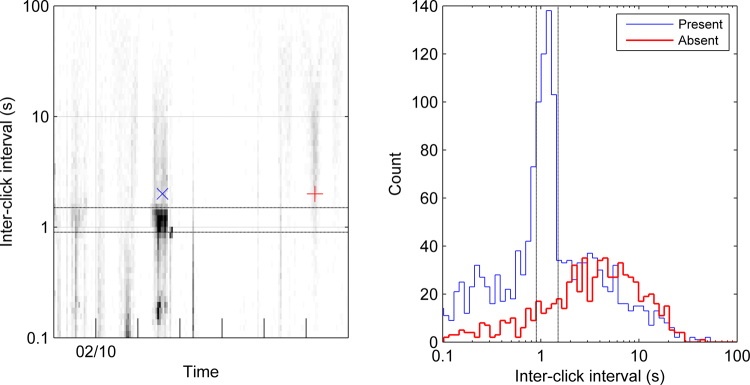
Figure 5.
Left: Example ICIgram from a week of data starting on 9 Feb 2013 for the Prydz site. The blue cross marks a time period with manually verified presence of sperm whales. The red plus indicates a time period where the analyst did not detect sperm whales. Right: ICI histograms for two different hour timespans from the Prydz site. The blue line represents the hour long timespan of the blue cross on the left plot (14:00 on 11 Feb 2013). The red line shows an hour-long timespan at the time of the red plus on the left plot (05:00 on 15 Feb 2013). Dashed lines indicate the limits of the ICIs used for classification of sperm whales (bins that comprise S from Eq. 1).

