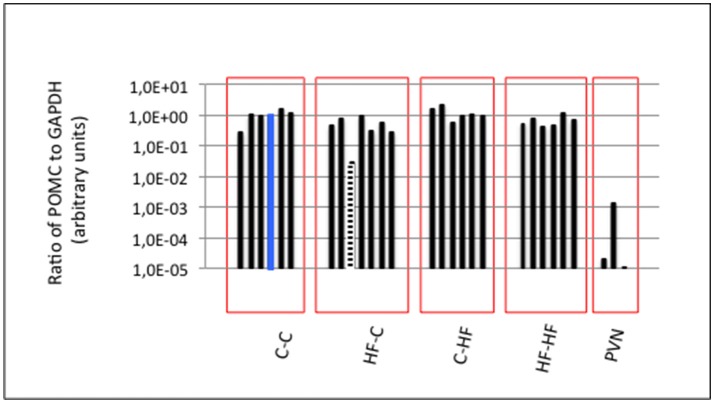
Figure 2.
ARC molecular characterization. The ARC harbors a neuronal population specifically expressing POMC transcripts when compared to the surrounding hypothalamic nuclei including the PVN. GAPDH and POMC expression were analyzed by RT-qPCR. POMC expression was normalized to GAPDH expression in each ARC and PVN. Ratio in one ARC of Group C-C (blue bar) was taken as the reference ratio. Ratios are shown using a log10 scale. All ARCs displayed POMC to GAPDH ratios at least a hundred-fold higher than those characterizing the PVNs except one ARC of Group HF-C (hatched bar) that was excluded from further analyses. Twenty-four ARCs (six ARCs/group) were conserved for analyses of miRNA populations.

