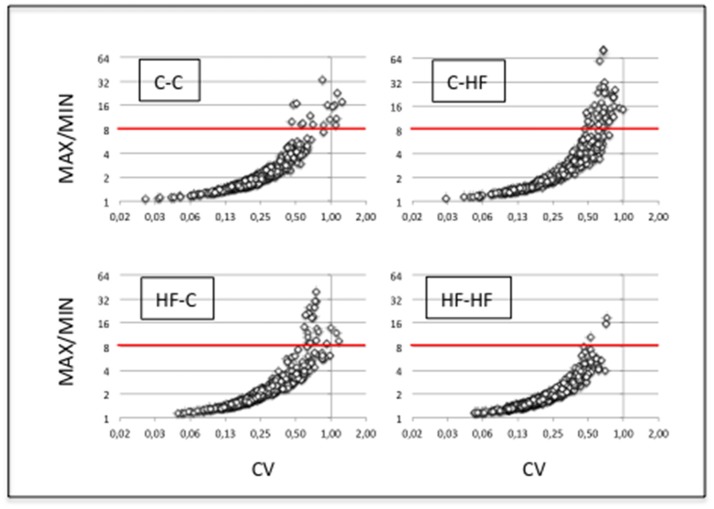
Figure 4.
miRNA expression displays high intra-group homogeneity. We characterized complex populations of some 400 miRNAs. In each group and for each miRNA, we analyzed the variation of expression between the six profiles by calculating the maximal to minimal ratio (MAX/MIN) and the standard deviation to mean ratio (coefficient of variation; CV). For each group, scatter plots of MAX/MINs against CVs are drawn. Note that X- and Y-axes used a log2 scale. Red lines identify the threshold value of mean + 2 STD in group C-C (i.e., 8.3). More than 94% of the miRNAs displayed close MAX/MINs and/or CVs in each group indicative of extensive intra-group homogeneity of miRNA expression.

