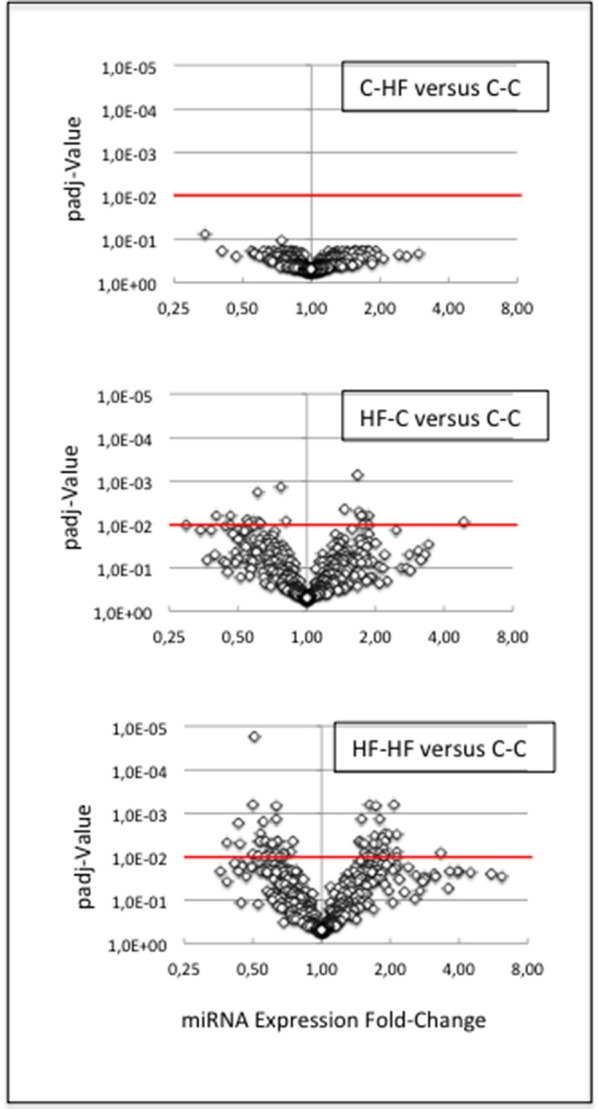
Figure 6.

miRNA response to metabolic challenge. We compared miRNA expressions between groups C-C and C-HF, HF-C, or HF-HF. For each comparison, the volcano plot displays padj-values plotted against expression fold-changes. X- and Y-axes are drawn using log2 and log10 scales, respectively. Values higher than 1 on the X-axis denote up-regulated miRNAs in groups C-HF, HF-C, or HF-HF, and values lower than 1, down-regulated miRNAs. Red lines identify the threshold padj-value of 1.0E-2. (Upper Plot) C-HF vs. C-C comparison. All padj-values were higher than 7.0E-2. miRNAs did not display any expression difference. (Middle Plot) HF-C vs. C-C comparison. Eighteen miRNAs displayed significant difference of expression. (Lower Plot) HF-HF vs. C-C comparison. Sixty miRNAs displayed significant difference of expression. The expression of several miRNAs was impacted by the perinatal only, or perinatal and adult, unbalanced environment.
