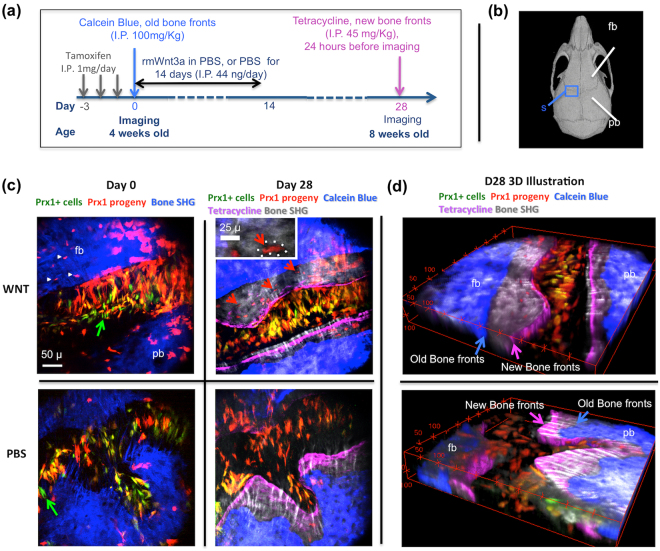
Figure 1.
In vivo, multi-color two-photon imaging. (a) Injection regimens and imaging time points for in vivo histomorphometry. (b) The coronal suture space (S) between frontal (fb) and parietal (pb) bones. (c) Animals were treated with either rmWnt3a (in PBS, 44 ng/day) or just PBS for 14 days. Maximum intensity projection of a 25-μm layer was used for demonstration. Images on Day0 show Prx1 + cells (Green), their progeny (Red or yellow, co-expression of tdTomato and EGFP). In addition, on Day 28, the initial bone structure was identified by calcein blue (Blue) and the new bone fronts were demarcated by tetracycline (purple), as indicated by blue and purple arrows in Fig. 1(d). Spontaneous recombination (white arrowheads) and incomplete recombination (green arrows) may be present. It is noted that a higher number of osteocytes originated from Prx1 + cells were embedded in lacunae (the red arrows and the inset) from rmWnt3a treatment. (d) Quantifications of bone morphometry and cellular dynamics were performed over a 50-μm layer, as shown in 3D reconstructed images.

