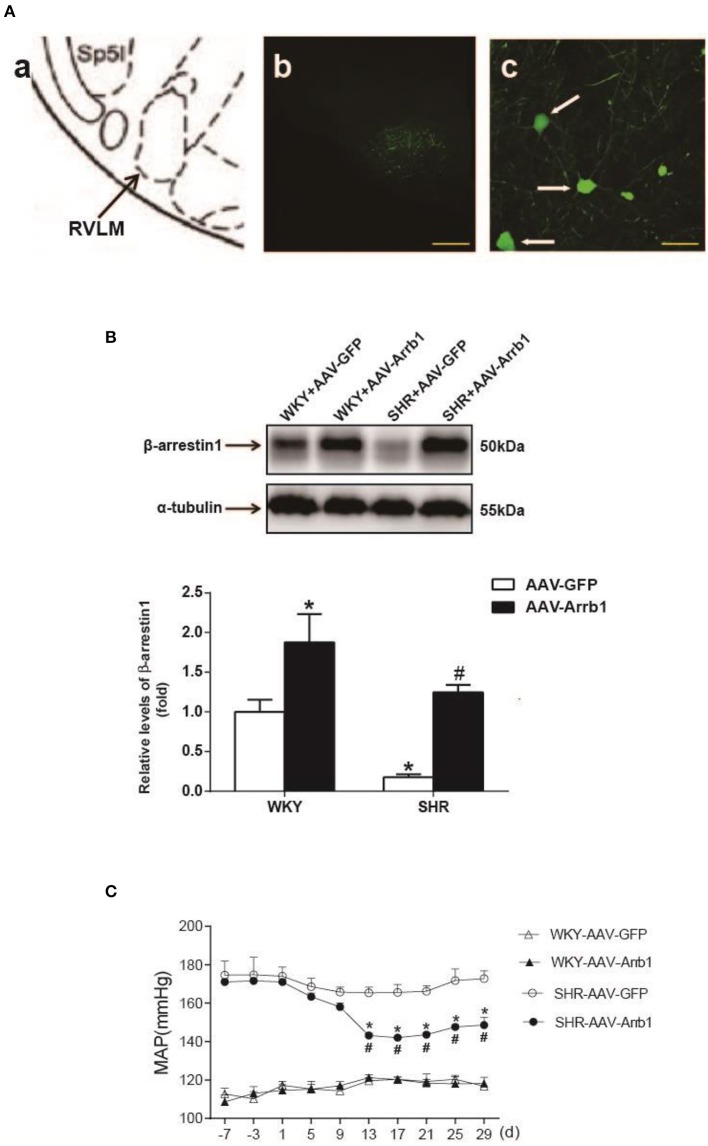
Figure 2.
Effects of overexpression of β-arrestin1 in the RVLM on cardiovascular activity in SHR. (A) According to the rat's atlas (a), green fluorescent protein (GFP) was expressed in the RVLM area (b,c). Scale bars = 200 μm in b and 50 μm in c. (B) Representative gel bands (top) and quantification bar graph (bottom) showed the protein levels of β-arrestin1 in the RVLM in the four groups. *P < 0.05 vs. WKY-AAV-GFP group; #P < 0.05 vs. SHR-AAV-GFP group. (C) Levels of MAP in the conscious groups (WKY+AAV-GFP, WKY+AAV-Arrb1, SHR+AAV-GFP, SHR+AAV-Arrb1). n = 5 per group. *P < 0.05 vs. SHR-AAV-GFP group; #P < 0.05 vs. d1.

