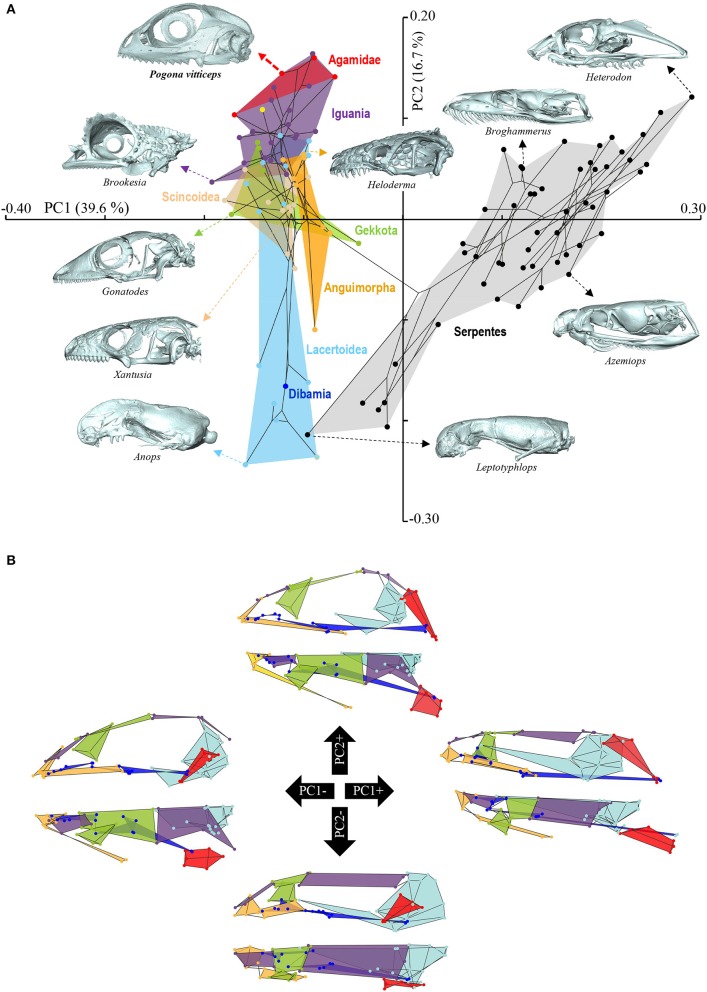
Figure 4.
Principal component analysis of cranium shape variation in squamates. (A) Phylomorphospace showing the cranium shape distribution of major groups of squamates: Dibamia (dark blue tip node), Gekkota (green shading and tip nodes), Scincoidea (brown shading and tip nodes), Lacertoidea (light blue shading and tip nodes), Anguimorpha (orange shading and tip nodes), Iguania (purple shading and tip nodes), Agamidae (red shading and tip nodes), and Serpentes (gray shading and black tip nodes). Color-codings are as in Additional File 1. Numbers in brackets indicate the percentage of variance explained by each of the PC axes. The 3D rendered craniums (indicated by colored dashed arrows, with species names) corresponding to representative lizard and snake species in both positive and negative directions are shown. The extreme position of Pogona vitticeps at positive PC2 values is highlighted in bold. (B) For each PC, the extreme cranium shapes at positive (+) and negative (–) values are depicted as wireframe diagrams. Cranium regions showing the greatest variations in shape are indicated by colored landmarks and shadings: quadrate (red), braincase (light blue), palate (dark blue), skull roof (apart from frontal, purple), circumorbital bones (green), tooth-bearing bones (orange). Lateral (top wireframe) and dorsal (bottom wireframe) views of one cranium side are shown for each extreme PC.

