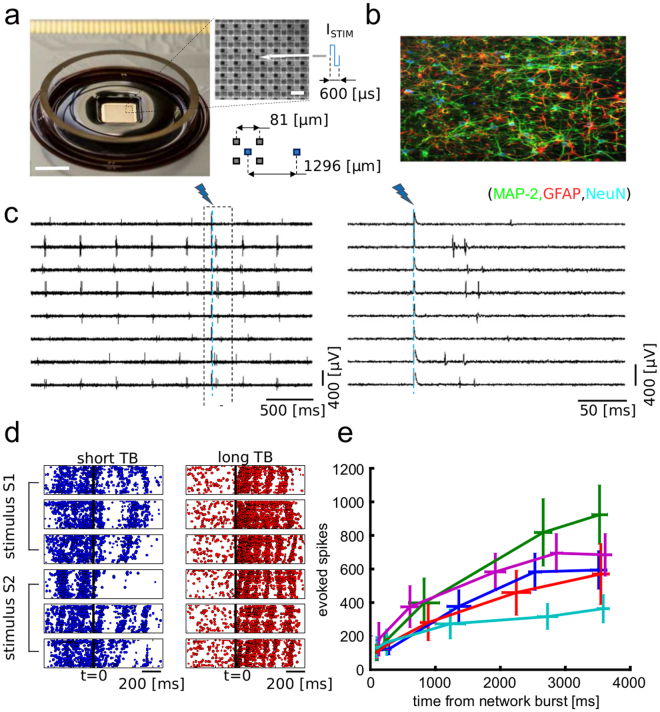
Figure 1.
High-resolution recordings of ongoing activity and electrically evoked responses in neuronal networks. (a) View of a CMOS-MEA chip and close up on the electrode array. The arrow indicates an electrode for electrical stimulation. Scale bars represent 5 mm (left) and 80 µm (close-up, right). (b) Immunofluorescence image of a hippocampal neuronal network, obtained in separate pilot experiments in which neurophysiology was not performed, grown on-chip for 18 DIVs and stained for MAP-2 (green), a neuron-specific marker for dendrites, GFAP (red), a marker for astrocytes and NeuN (blue), a maker for neuronal nuclei. (c) Raw traces (left) and close-up around the stimulation instant (right) of representative electrodes showing ongoing and evoked spiking activity. (d) Raster plots illustrating the difference between evoked network response obtained with stimuli delivered at short (left) and long (right) time TB. Plots for two stimuli (S1, S2), delivered from two different electrodes, and for three stimulation trials are reported. As shown, for short TB (left) the response to a stimulus delivered at t = 0 is weaker than the response obtained for stimuli delivered at long TB (right). (e) Quantification of the averaged evoked number of spikes over a time window of 100 ms after stimulation as function of TB (8 different stimuli, 60 trials per stimuli). Each trace refers to a different cell culture. The TBs were grouped in quintiles. The reported mean and SEM on the x axis are computed over the quintiles of the TB distribution. The mean and SEM on y axis are computed on the corresponding evoked spikes.

