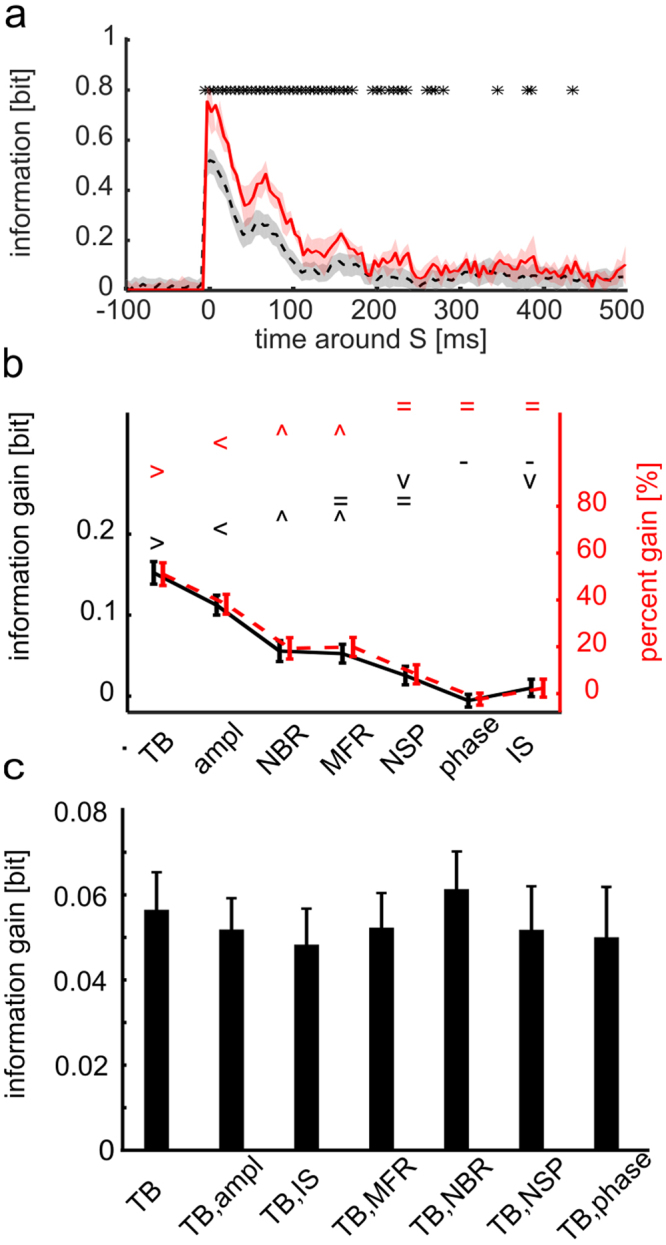
Figure 2.

Post-stimulus response carries higher information about the stimulus when considered together with pre-stimulus state variable θ. (a) Time course of the across-sessions average (n = 5) of the information I(S; R, Θ) about stimuli carried by responses R and state variables Θ = TB (red solid line) and the across-sessions average of the information I(S; R)computed when destroying the information in the variable Θ by shuffling its values across trials (black dashed line). The red area delimits SEM across sessions of I(S; R, Θ). The grey area around I(S; R) delimits the area between the 5th and 95th percentiles of the average across sessions of the distribution I(S; R, ΘSH) obtained with N = 200 random permutations of state variables Θ across trials. Stars indicate time points in which I(S; R, Θ) is significantly higher than I(S; R) (one-tailed permutation test, p < 0.05 FDR corrected). (b) Mean and SEM across experiments of information gain (black line) and percentage information gain (red dashed line) in a [0 100] ms time window after the stimulus, for different state variables. Symbols { > < ^ = −} mark data groups that have similar means (Tukey’s HSD, p < 0.05), see Supplementary Information. Black and red symbols indicate not significantly different means for, respectively, information gain (F(6, 639) = 76.06, p = 10−73 one-way between subject ANOVA followed by Tukey’s HSD multiple comparison test) and percentage information gain (F(6, 639) = 46.84, p = 10−48, same test). State variable TB has information gain and percentage information gain significantly higher than other considered state variables. (c) Mean and SEM across experiments of the decoded information gain summed in a [0 100] ms time window after the stimulus, for the TB state variable and corresponding bi-dimensional state variables (where TB is paired with either ampl, IS, MFR, NBR, NSP and phase). There are no significant different sessions averages of decoded information for any comparison between bi-dimensional and one-dimensional state variables (F(6, 28) = 0.18 with p = 0.98, one-way between subject ANOVA).
