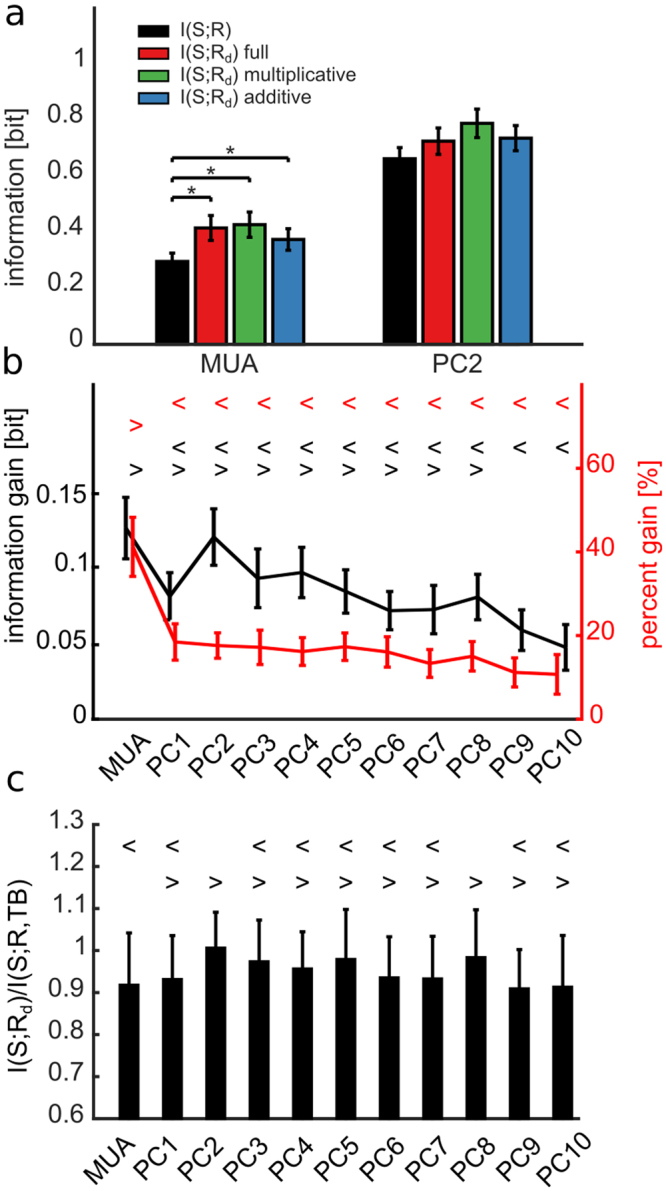
Figure 5.

Discounting predicted trial-to-trial response variability from single trial response increases the stimulus information. (a) Mean ± SEM across all experiments of the mutual information between stimulus and response in a post-stimulus time window of [0 100] ms. We considered either MUA or PC2 as response representations. Information is computed before (I(S; R), black bars) and after (I(S; Rd)) discounting from the single trial response r the trial-to variability predicted by, respectively, the full model (red bars), the purely multiplicative (green bars) and the purely additive (blue bars) model. Among the evaluated response features only MUA shows significant differences between I(S; R) and I(S; Rd) for the full, multiplicative and additive models (black asterisk, F(3,396) = 8.58, p = 10−5, one-way between subject ANOVA followed by Tukey’s HSD multiple comparison test), whereas differences are not significant (p = 0.07) for PC2. (b) Information gain and percentage information gain for different response representations computed using the purely multiplicative model. Symbols {> <} mark data groups that have similar means (Tukey’s HSD, p < 0.05), see Supplementary Information. Black and red symbols indicate not significantly different means for, respectively, information gain (F(10, 1089) = 3.6, p = 10−5, one-way between subject ANOVA followed by Tukey’s HSD multiple comparison test) and percentage information gain (F(10,1089) = 7.9, p = 10−12). (c) Mean ± SEM across all experiments of the discounted information ratio, measured as the ratio between I(S; Rd) and I(S;R, TB) (F(10, 1089) = 2.6, p = 0.003). Symbols {> <} mark data groups that have similar means (Tukey’s HSD, p < 0.05), see Supplementary Information.
