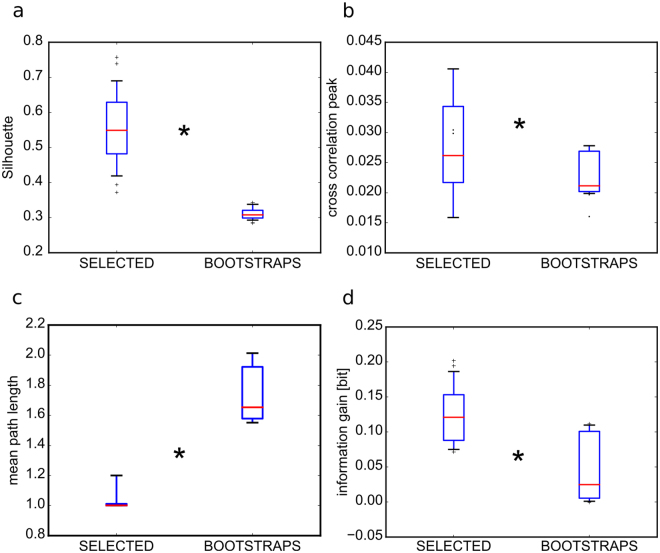
Figure 8.
Spatial structure of electrodes selected by thresholding PCs. In all panels the electrodes are selected with PC weights higher than 3 SDs (SELECTED). All measures on SELECTED are compared to measures on equally sized sets randomly chosen from the complementary set of the non selected electrodes (n = 100 repetitions) and the 95th values of those bootstraps are reported (BOOTSTRAPS). All box-plots are relative to the pooling of 10 PCs and 3 experiments. Red horizontal lines are means computed across 3 experiments, boxes show the interquartile range and the whiskers correspond to the 5th and 95th percentiles. (a) The silhouette coefficients, a measure of goodness of spatial clustering, are significantly higher when computed on the SELECTED electrodes respect to the BOOTSTRAPS (Wilcoxon signed-rank test, n = 30, p = 10−5). (b) The mean peak cross-correlation coefficients are significantly higher among the SELECTED electrodes respect to the BOOTSTRAPS (Wilcoxon signed-rank test, n = 30, p = 10−6). (c) Similarly, the mean path length is shorter among the SELECTED electrodes respect to the BOOTSTRAPS (Wilcoxon signed-rank test, n = 30, p = 0.001). (d) Finally, the information gain, computed over the [0 100] ms time window, is higher in the SELECTED electrodes respect to the BOOTSTRAPS (Wilcoxon signed-rank test, n = 30, p = 10−6).

