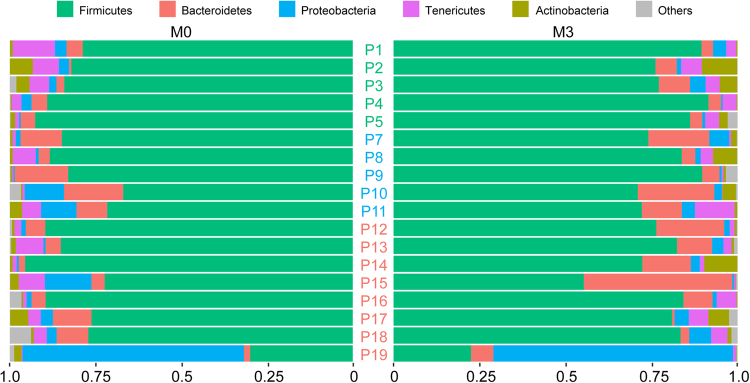
Figure 1.
Proportion of reads assigned to different phyla. For each patient reads assigned with Tango were summed up at the phylum level. Proportions of reads belonging to five dominant phyla coloured according to the legend above are shown. Each row corresponds to one patient at M0 and M3, left and right, respectively. P1-P5 responders (green), P7-P11 partial responders (blue), P12-P19 non responders (red). Median proportions per phylum ± SD are as follows: Firmicutes − 0.82 ± 0.15, Bacteroides − 0.05 ± 0.08, Tenericutes − 0.03 ± 0.03, Proteobacteria 0.02 ± 0.15.

