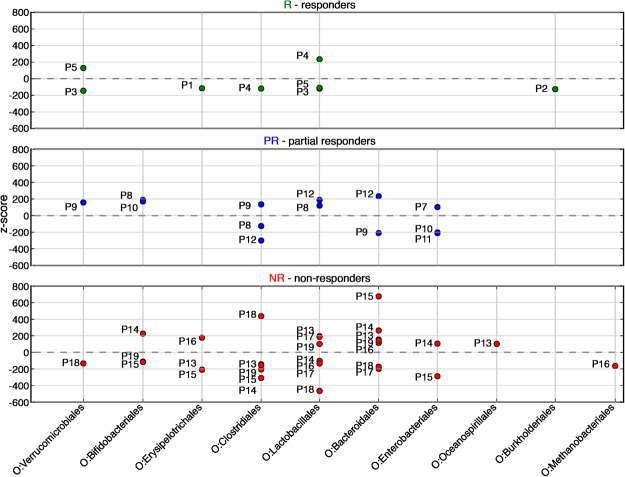
Figure 2.
z-scores analysis at the order level. Each point represents z-score between M0 and M3 for one order for one patient. Dots above the zero black dotted represent an increase in the corresponding taxa’s proportion in the corresponding patient’s gut microbiome after the TNF alpha treatment, while dots below this line represent a decrease. Reads assigned with Tango were summed up for each patient at the order level and normalized. The z-scores were calculated between proportions of reads of each order at M0 and M3 (relative to the total number of reads in the sample) for each patient and filtered by . P1-P5 responders (green), P7-P11 partial responders (blue) P12-P19 non responders (red).

