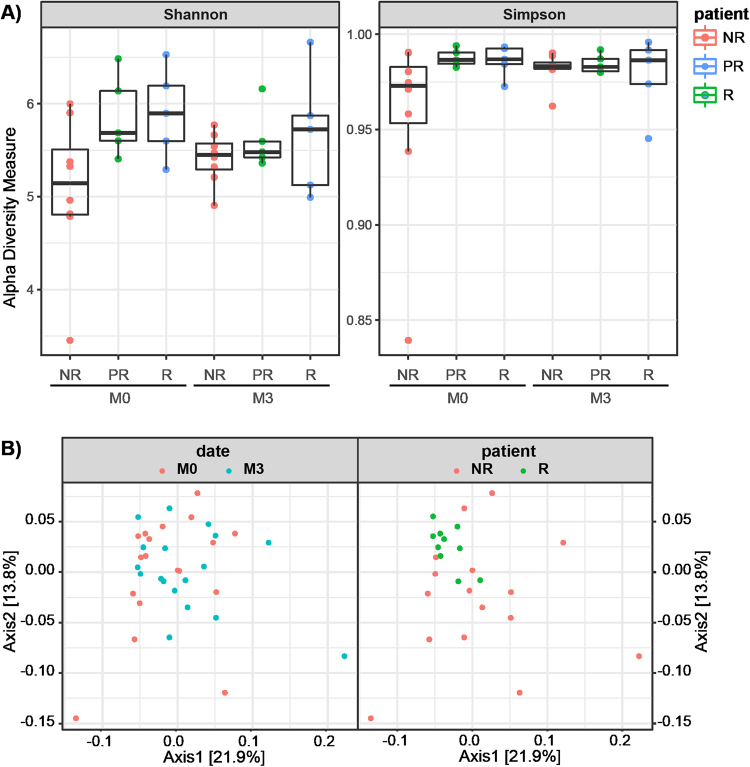
Figure 3.
Diversity plots for microbiota patient samples. (A) Shannon and Simpson diversity indices calculated based on OTU analysis for each type of patient at M0 and M3. Shannon index for NR is significantly different than for R at M0 (two-tailed t-test with unequal variance, p-value = 0.04). (B) PCoA plot of β-diversity calculated by weighted UniFrac distances on OTU occurrence table. Left graph is coloured by the date of the sample. Timepoints M0 and M3 do not form separate clusters (ANOSIM, R = −0.011, p-value 0.641). Right plot is colored by the type of patient’s response (partial responders are removed for clarity). Patients with different level of response form significant clusters (ANOSIM, R = 0.1032, p-value 0.042).

