Figure 6.

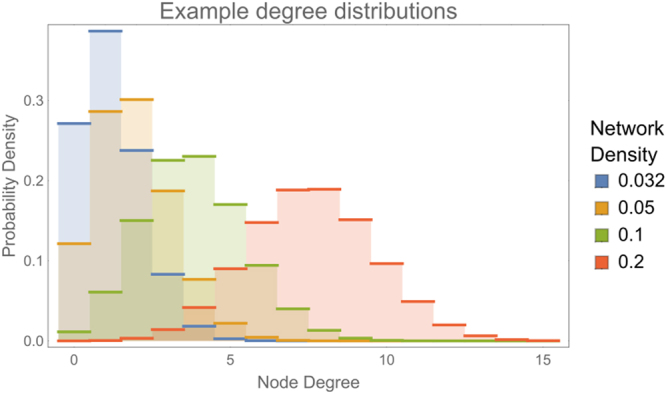
Example degree distributions for synthetic data validation. All distributions were generated for three uniform graph distributions with network densities 0.032, 0.05, 0.1 and 0.2 (from left to right, respectively).

Example degree distributions for synthetic data validation. All distributions were generated for three uniform graph distributions with network densities 0.032, 0.05, 0.1 and 0.2 (from left to right, respectively).