Figure 6.

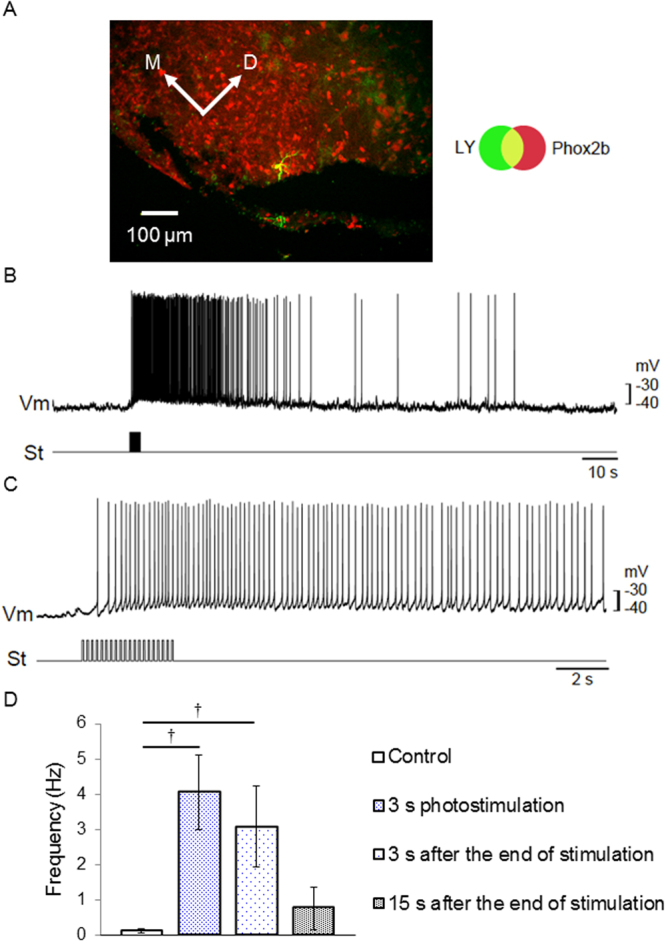
Optical manipulation of neural excitability in the central nervous sytem (CNS). (A) A sample pFRG neuron which was immunoreactive with Phox2b (red) and stained with Lucifer yellow in the patch electrode (green). (B) membrane potential trajectory during photostimulation (460–470 nm, 0.1–0.2 mWmm−2, duration 50 ms, interval 150 ms, 6.7 Hz). Upper trace (Vm), membrane potential; lower trace (St), photostimulation given as a train of light pulses. (C) Similar to B, but the response of another neuron to shorter train of photostimulation pulses. Note that the time scale is different. (D) Summary of neuronal excitability (n = 6). The firing frequency was compared at different time points of photostimulation: before photostimulation (the first column), 3 s after photostimulation (the second column), 3 s after end of photostimulation (the third column) and 15 s after end of photostimulation. †P < 0.005, Wilcoxon signed rank test.
