Fig. 4.
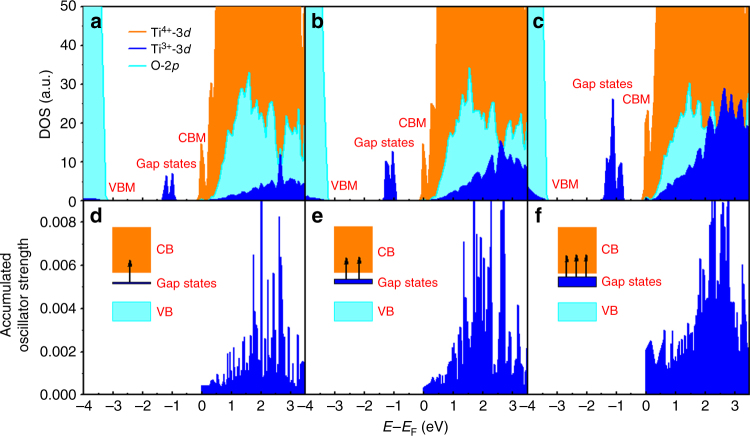
Density of states (DOS) and corresponding accumulated oscillator strength of defective anatase TiO2. a–c DOS of TiO2 surface with 1Ov, 2Ov, and 4Ov per slab, respectively. d–f Oscillator strength of TiO2 surface with 1Ov, 2Ov, and 4Ov per slab, respectively. The oscillator strength was calculated for transitions from gap states to conduction band (CB). The orange, blue, and light green area in the DOS stand for projected DOS of Ti4+ ions, Ti3+ ions, and O2− ions, respectively. The gap state, valence band maximum (VBM), and conduction band minimum (CBM) are indicated in the DOS. Accumulated oscillator strength is calculated by summing the component data of y and z direction in Supplementary Fig. 24

