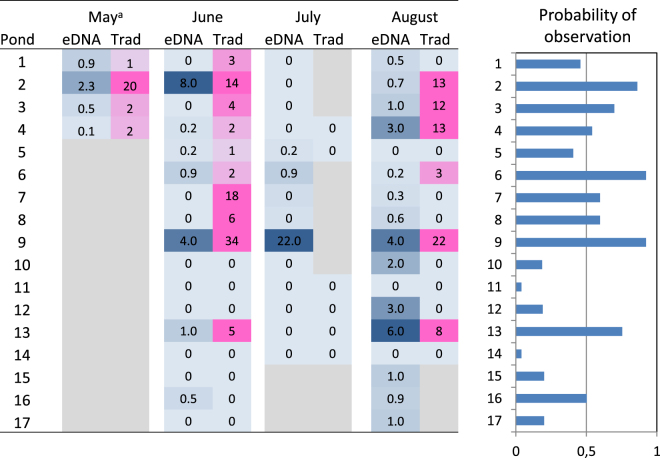
Figure 3.
Observations of P. lessonae in 17 ponds in Forsmark between mid-May and the end of August 2016. Left) Heatmap showing eDNA concentration in pg per litre (blue) and the number of frogs observed with traditional methods (pink). Right) Between-pond variation in the predicted probability of observing frogs estimated from a joint logistic regression of the two methods. (Bars represent the average of both methods in June). “Months” corresponds to the life-cycle as follows: spawning season (May-June), tadpoles (July) and small and adult frogs (August). a = mean value from three separate visits.

