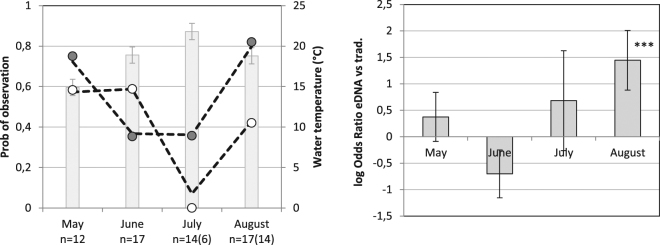
Figure 4.
Comparison of methods to detect P. lessonae over the sampling period from mid-May to end of August 2016. Left) observed and predicted (dashed line) rate of observation with eDNA (grey circle) and traditional methods (white circle). Grey bar (±S.E.) represent the average water temperature. n = number of samples (observational method in parenthesis). Right) Log odds ratios (±S.E.) for observation with the eDNA vs. the traditional methods. ***Indicate a p-value < 0.001.

