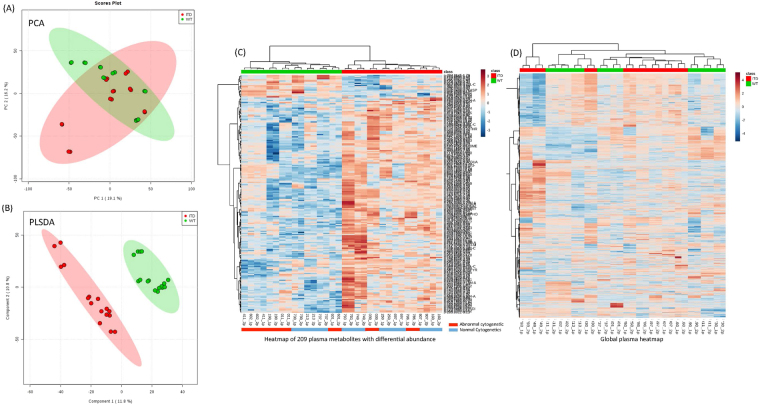
Figure 1.
Plasma Metabolic differences between FLT3-ITD and FLT3-WT AML. (A) PCA plots of plasma samples. Unbiased multivariate analysis does not show clear separation of samples based on FLT3 status groups. (B) PLSDA plot of plasma samples shows global separation of pediatric AML patients by FLT3 status (FLT3-ITD n = 8 and FLT3-WT n = 8, all samples were run in duplicate). (C) Heatmap shows relative abundance patterns of 209 plasma metabolites (known and un-annotated) with significantly differential abundance according to FLT3 status. Clustering within the heatmap shows a clear distinction of several metabolites between in FLT-WT and FLT3-ITD patients. (D) Heatmap of the global metabolome for patient plasma samples from AML patients.

