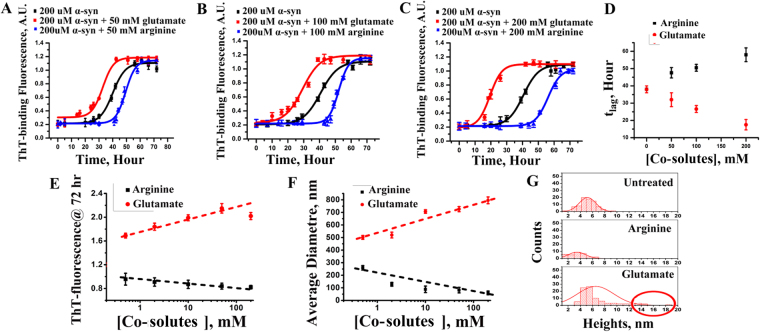
Figure 1.
(A) ThT-binding fluorescence with 50 mM, (B) 100 mM and (C) 200 mM arginine(blue) and glutamate(red) concentrations. ThT-binding fluorescence of wild type α-syn had been shown as a control (black) set of data in these figures; Data shown are mean ± standard error. Error bars of ThT fluorescence experiments are calculated after repeating the experiments independently for eight times. (D) The variations of tlag of amyloidosis with arginine and glutamate concentrations are also shown. (E) Plot of ThT fluorescence at the saturating condition (72 hour) with increasing concentrations of arginine (black) and glutamate (red) from 500 µM to 200 mM. (F) Plot of average diameter in nm (from DLS) (repeated at least for three times) at the saturating condition with increasing concentrations of arginine (black) and glutamate (red) from 500 µM to 200 mM. For both E and F, x-axes were plotted using log scale, and hence the values at zero concentration are not shown, (G) Histogram of counts and height of α-syn fibrils at the saturated phase calculated from AFM data. Circle shows appearance of fibrils with heights ranging from 12–20 nm.

