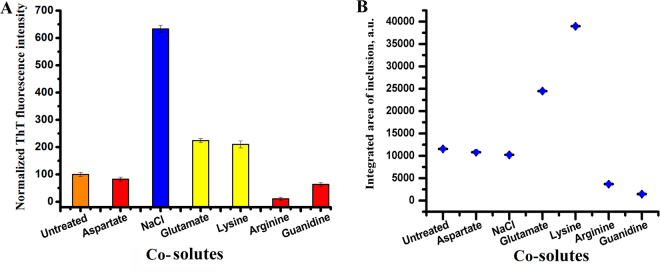
Figure 4.
Aggregation screening of α-syn using different small molecules. Error bars have been calculated after repetition of the experiments in aqueous solution for three times. (A) Normalized ThT fluorescence data of α-syn in the absence and presence of small molecules after 72 hours of agitation (completion of aggregation of α-syn). Concentration of α-syn is 200 µM and concentration of small molecules used is 100 mM (except for Gdm-HCl which is 10 mM). (B) The integrated area of α-syn inclusions inside SH-SY5Y cells have been plotted in the absence and presence of different small molecules at 500 μM concentration.

