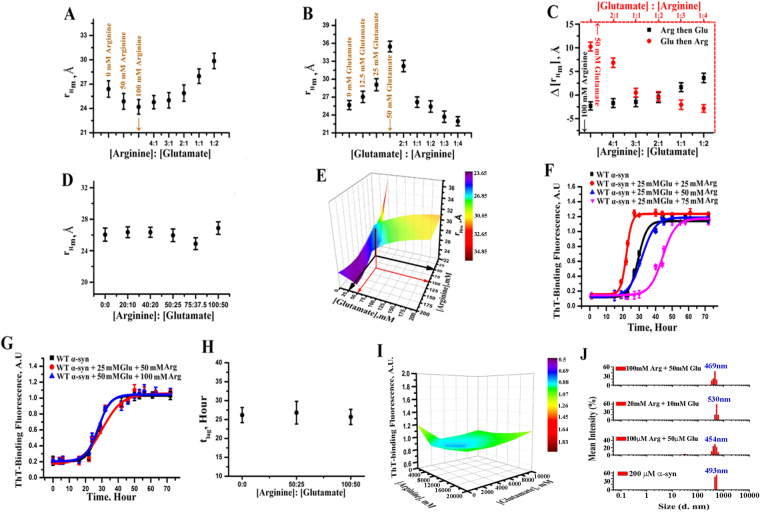
Figure 6.
(A) The variations of mean hydrodynamic radius (rHm, Å) with concentrations up to 100 mM of arginine, followed by addition of different concentrations of glutamate; (B) the variations in rHmwith glutamate concentration up to 50 mM, followed by addition of arginine of increasing concentrations; (C) the variation in ∆rHmat different ratio of arginine:glutamate (black) and glutamate:arginine(red). ∆rHm has been calculated by subtracting the value of rHm at a particular osmolyte (arginine or glutamate) concentration from that observed in the absence of osmolyte; (D) rHm at different concentrations of arginine and glutamate mixture keeping the ratio constant at 2:1. (E) 3D contour plot using the values of rHm of both experiments of (A) and (B); The color cyan indicates the values of rH at the concentration ratios of 2:1 (corresponding to 50 mM, 25 mM of arginine, glutamate shown by the black arrow; and 100 mM, 50 mM arginine, glutamate shown by the red arrow) (red) are similar to the native form of protein in the absence of any co-solvents. Color scale bar was shown beside the plot. (F) Amyloidosis kinetics of α-syn at different ratios; 1:1 (red), 2:1 (blue) and 3:1 (pink)] of arginine and glutamate are shown. The data of WT α-syn in aqueous buffer in the absence of any osmolytes(black) is shown as control data set; (G) Amyloidosis kinetics of α-syn with different concentrations of arginine and glutamate (50:25 as red and 100:50 as blue) keeping the ratio constant at 2:1; (H) the variations of tlag of amyloid formation for these mixtures with fixed ratio of 2:1. The data clearly show that arginine inhibits and glutamate facilitates amyloidosis kinetics and the arginine to glutamate ratio of 2:1 cancels each other’s influence completely; Data shown are mean ± standard error. Error bars of the FCS experiments were calculated after repeating the experiments independently for five times. (I) 3D contour plot shows variation of ThT-binding fluorescence at saturated condition with different concentrations of arginine and glutamate keeping 2:1 ratio constant. (J) DLS measurement of size of WT α-syn at saturated condition with 2:1 ratio of arginine and glutamate. All the DLS experiments are repeated at least for three times.

