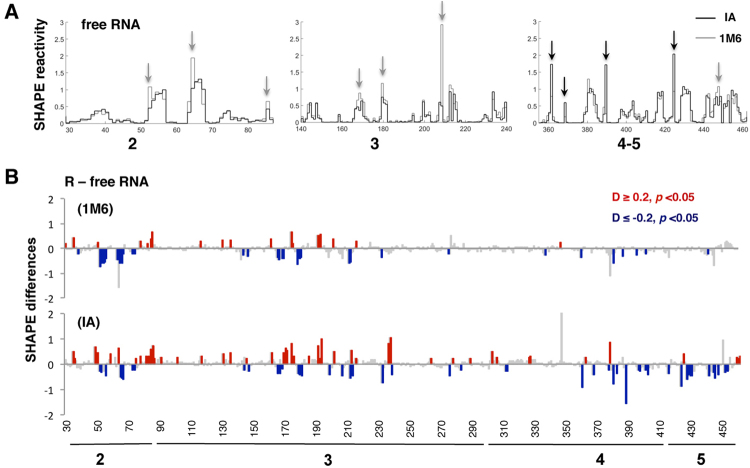
Figure 1.
Conformational changes in the RNA local flexibility of the IRES incubated with native ribosomes. (A) Reactivity patterns for IA (black) and 1M6 (gray) reagents obtained after QuSHAPE software processing for representative regions of domain 2, 3 and 4–5 of the free IRES element. Black and grey arrows depict some examples of enhanced reactivity toward IA or 1M6, respectively. (B) Statistically significant SHAPE differences towards IA and 1M6 of the RNA incubated with R fraction relative to free RNA as a function of the nucleotide position. Red or blue bars depict nucleotides with p-values < 0.05 and absolute SHAPE reactivity differences higher or lower than 0.2, respectively. Grey bars depict non-statistically significant differences (p-values > 0.05 and/or absolute differences D <0.2).

