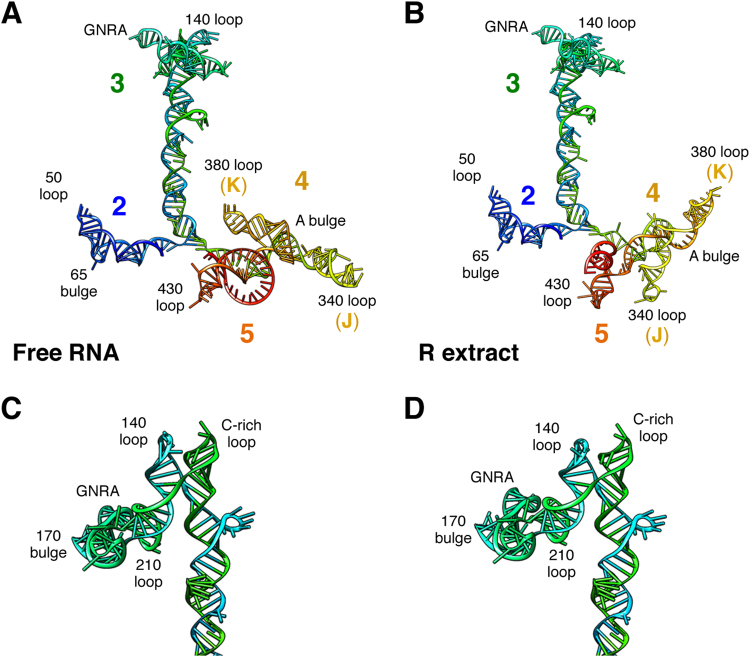
Figure 3.
RNA structure modeling of the IRES region. Predicted 3D structure models for the IRES imposing SHAPE reactivity values obtained for the free RNA (A) and upon incubation of the IRES transcript with the R extract (B). Domains 2, 3, 4, and 5, subdomains J and K of domain 4, as well as the GNRA tetraloop, loops, and bulges referred to as in the text are indicated. Detailed structure model of the apical region of domain 3 for the free RNA (C), and incubated with R extract (D).

