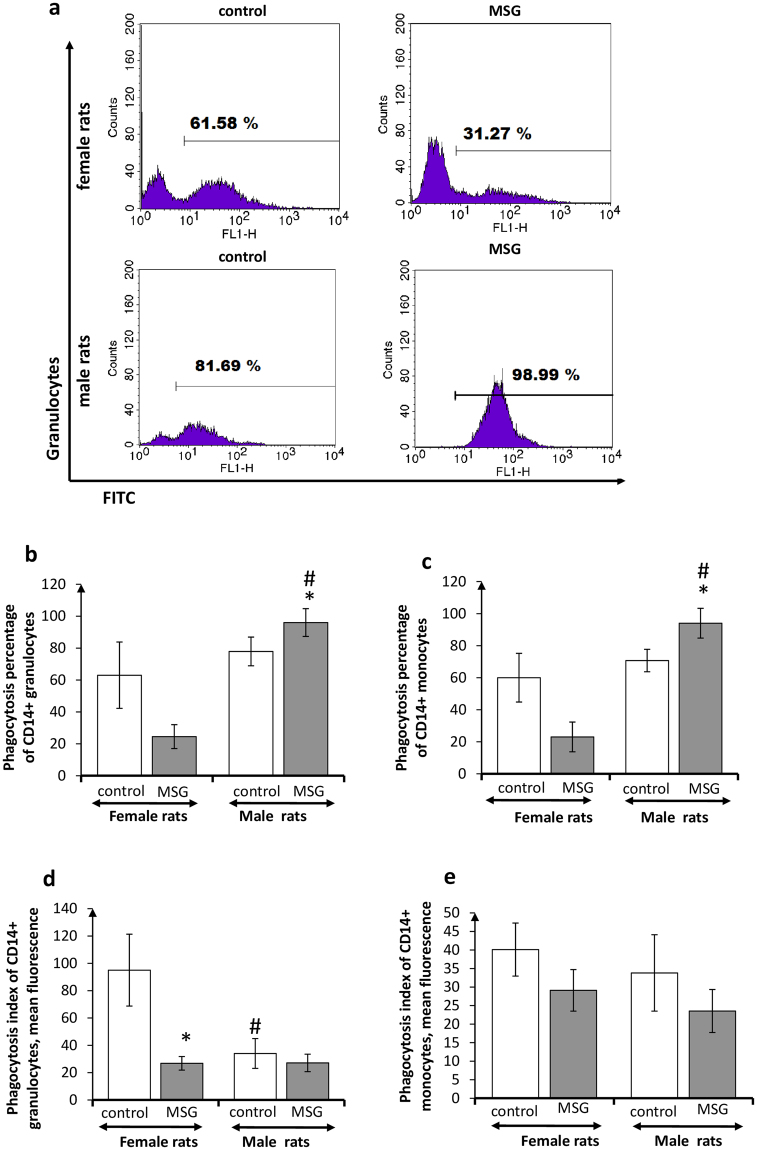
Figure 2.
Phagocytosis activity of CD14+ adipose tissue phagocytes in female and male rats with monosodium glutamate-induced obesity (MSG, n = 8). (a) Flow cytometry representative histograms for CD14+ phagocytizing granulocytes in female and male rats (FITC staining), quantitations of phagocytizing CD14+ cells in stromal vascular fraction are shown; (b,c) phagocytosis percentage of CD14+ granulocytes and monocytes, respectively; (d,e) phagocytosis index of CD14+ granulocytes and monocytes, respectively. Values in bar graphs are presented as mean ± SD. *P < 0.05 was considered significant, compared with the corresponding values of the control animal group. Comparisons between sexes (ANOVA) are shown as follows: #p < 0.05.

