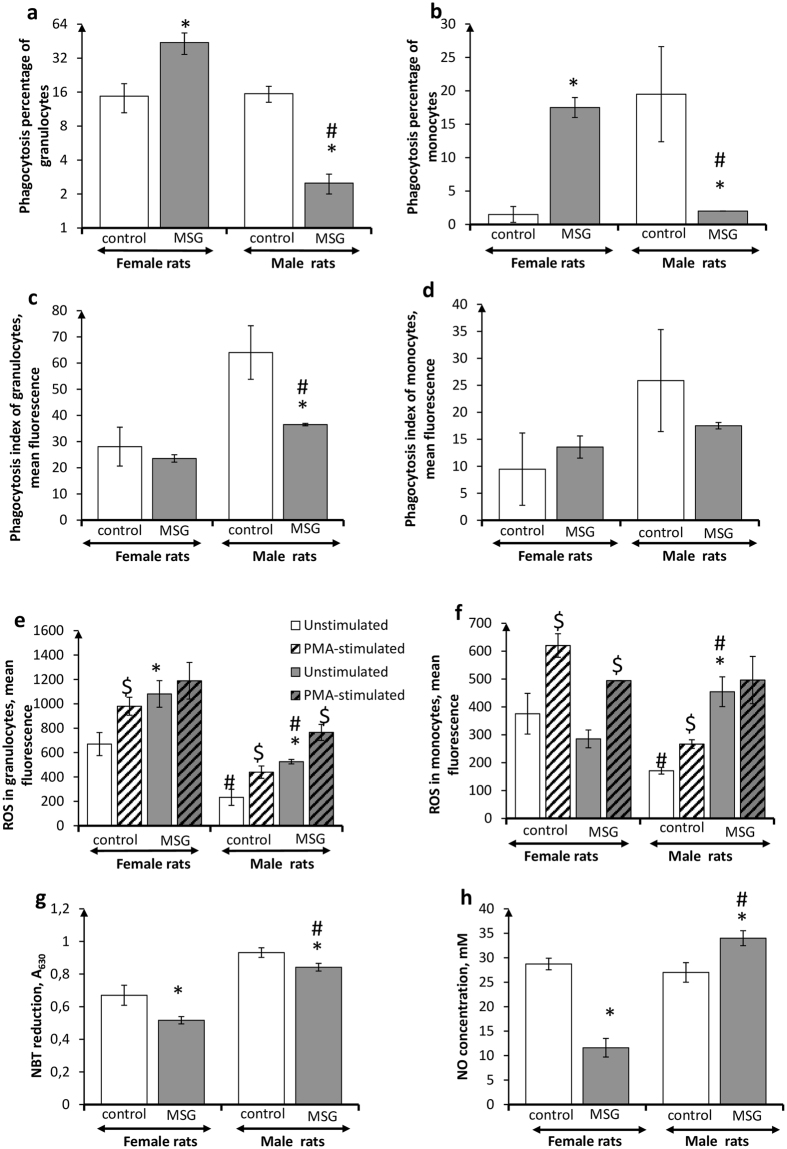
Figure 4.
Functional activity of peritoneal phagocytes in female and male rats with monosodium glutamate-induced obesity (MSG, n = 8). (a,b) Phagocytosis percentage of granulocytes and monocytes, respectively; (c,d) phagocytosis index granulocytes and monocytes, respectively; (e,f) intracellular ROS generation by granulocytes and monocytes, respectively; (g) extracellular ROS release (NBT-test); (h) NO release (measured as nitrite level). Data are presented as mean ± SD. *P < 0.05 was considered significant compared to the corresponding values of the control animal group. $P < 0.05 was considered significant, compared to the values of the corresponding unstimulated cells. Comparisons between sexes (ANOVA) are shown as follows: #p < 0.05.

