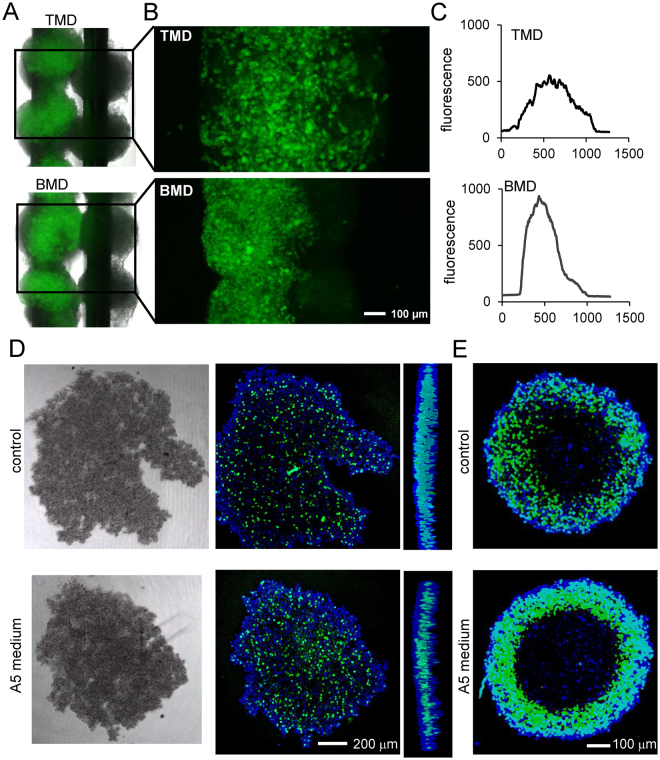
Figure 4.
Three-dimensional characterization of tumor-osteocyte interactions. (A & B) TMD and BMD cell spheroids (green), positioned adjacent to MLO-A5 spheroids (black) 48 h after 3D bioprinting. (C) Average fluorescence intensity along the axis perpendicular to the supporting needle shaft. (D & E) Click-iT EdU assay of proliferating cells in 4T1.2 cell spheroids and TMD cell spheroids, respectively, in the presence and absence of MLO-A5-conditioned media.

