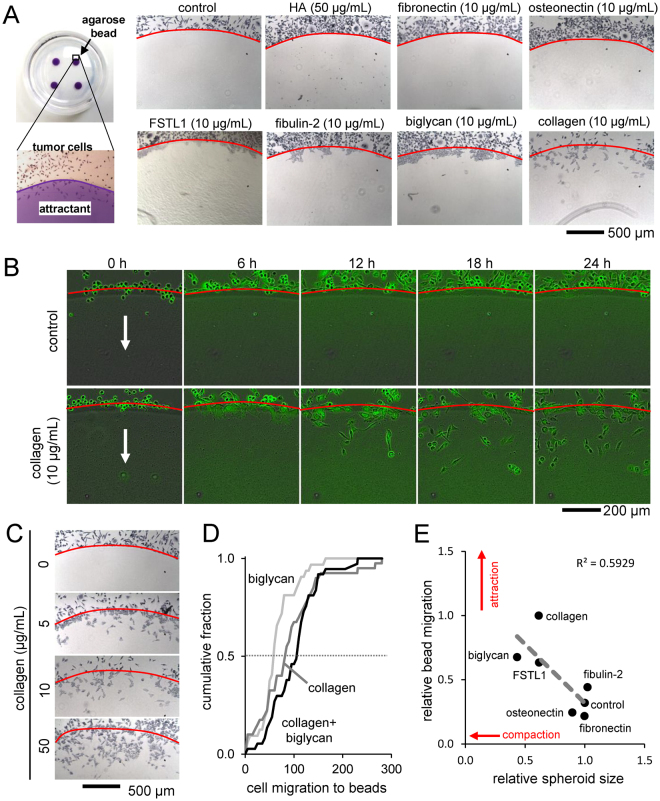
Figure 8.
Agarose bead assay. (A) Images of the edge of the agarose beads showing migration of TMD tumor cells under the beads loaded with various bone matrix proteins and compounds. (B) Time response of TMD cells migrating under control and collagen-loaded agarose beads. (C) Images of the edge of agarose beads in response to increasing concentrations of collagen. (D) Cumulative fraction of cell migration at the agarose bead edge for collagen, biglycan, and collagen biglycan combination. (E) Relative spheroid size correlates with relative bead migration by treatment with bone matrix proteins.

