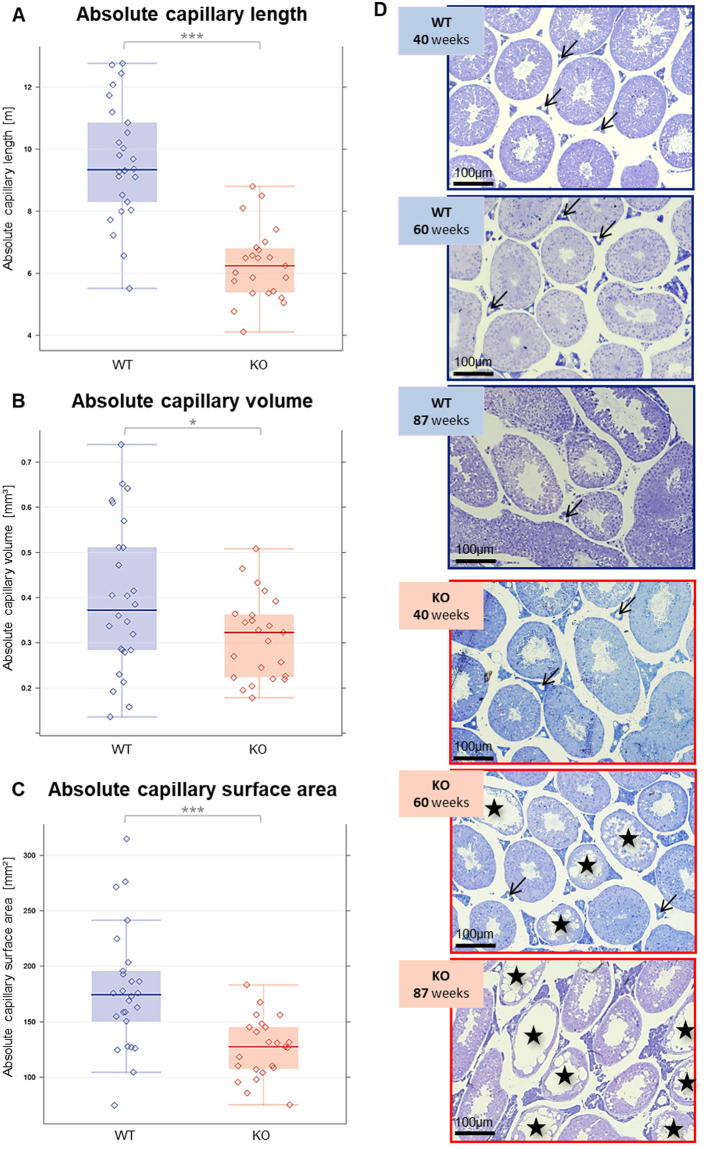
Figure 3.
(A–C) Absolute capillary length (A), capillary volume (B) and capillary surface area (C) in 40, 60, 87-week-old KO and WT mice (*p < 0.05, **p < 0.01, ***p < 0.001) as determined by stereology.  KO raw data;
  WT raw data;
  KO median;
  WT median;
  highest value still within 1.5 times the interquartile range of the third quartile of KO;
  highest value still within 1.5 times the interquartile range of the third quartile of WT;
  lowest value still within 1.5 times the interquartile range of the first quartile of KO;
  lowest value still within 1.5 times the interquartile range of the first quartile of WT;
  values between first and third quartile of KO data (indicating the middle 50% and the interquartile range);
  values between first and third quartile of WT data (indicating the middle 50% and the interquartile range); ↓ Capillaries; ӿ seminiferous tubules showing disturbed spermatogenesis. (D) Representative semithin sections from WT and KO testes of the different age groups are shown as an overview. (Arrows indicate examples of capillaries, asterisks mark tubules with disturbed spermatogenesis).

