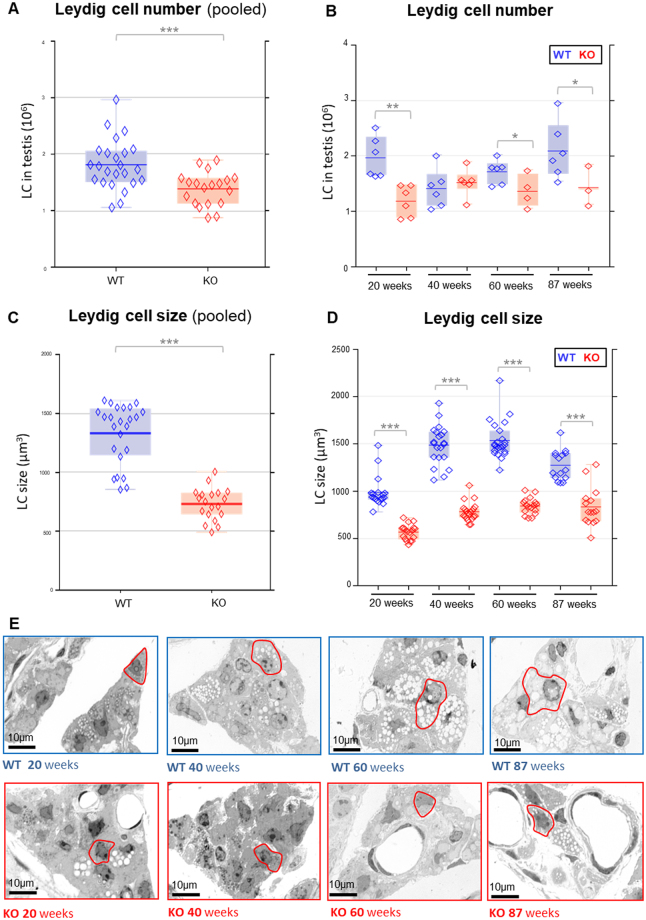
Figure 6.
(A–D) Leydig cell number (A and B) and size (C and D) in KO and WT mice analyzed by stereological investigations on semithin sections. (A,C) Leydig cell number (A) and size (C) of data from pooled age groups (20, 40, 60, 87 weeks). (B,D) Leydig cell number (B) and size (D) from the individual age groups. *p < 0.05, **p < 0.01, ***p < 0.001.  KO raw data;
  WT raw data;
  KO median;
  WT median.
  highest value still within 1.5 times the interquartile range of the third quartile of KO.
  highest value still within 1.5 times the interquartile range of the third quartile of WT.
  lowest value still within 1.5 times the interquartile range of the first quartile of KO.
  lowest value still within 1.5 times the interquartile range of the first quartile of WT.
  values between first and third quartile of KO data (indicating the middle 50% and the interquartile range).
  values between first and third quartile of WT data (indicating the middle 50% and the interquartile range). (E) Histological images of the testicular interstitial tissue of the different age groups in WT and KO mice (examples of Leydig cells are encircled in red).

