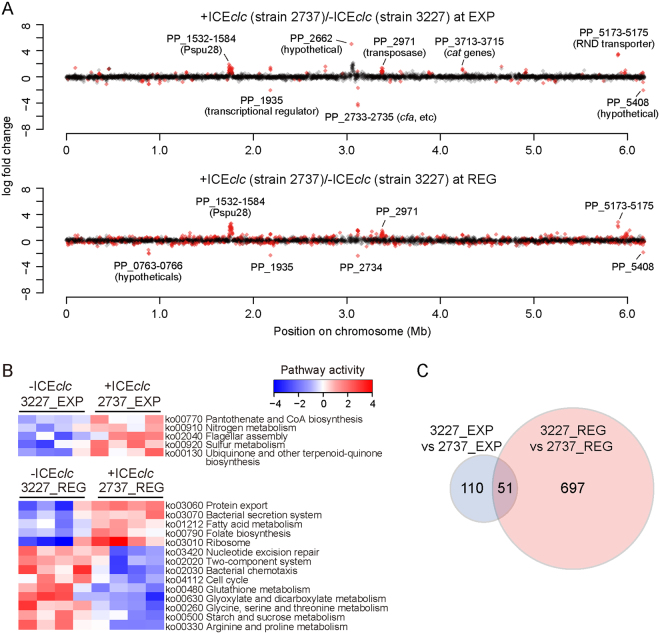
Figure 1.
Gene expression profiles in presence or absence of ICEclc. (A) Log2–fold change of gene expression between P. putida with ICEclc (strain 2737) and that with clc genes only (strain 3227) in exponential (upper) and REG phase (lower). Only genes with an a.value (mean expression values, calculated using the trimmed mean of M values (TMM) normalization method) >4.0 are plotted, according to their positions on the chromosome. Differentially expressed genes with a q-value < 0.05 are coloured in red. (B) Pathway activity in the presence/absence of ICEclc. Activities were inferred from significantly induced or repressed KEGG Pathways identified for each dataset comparison (p < 0.05 in two-tailed Welch t test). Blue/red blocks indicate pathways (rows) that are up/down regulated in quadruplicate samples (columns) of specific strains and growth phases (top). Pathways are clustered based on the similarity of their activities across samples. (C) Venn diagram showing overlap among differentially expressed genes (DEGs) among transcriptome datasets. The intersection shows the DEGs at a q-value < 0.05 that were common to both comparisons and with the same direction of expression change.

