Fig. 4.
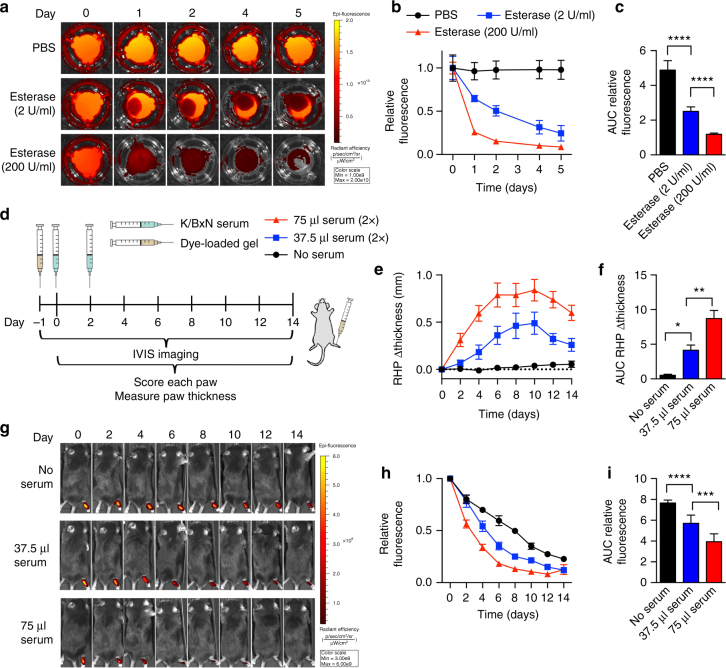
TG-18 hydrogel disassembly correlates with arthritis severity. a DiR-loaded hydrogels were incubated in PBS without or with esterase (T. lanuginosus lipase, 2 or 200 U/ml). To quantify fluorescence signals at each time point, transwell inserts with hydrogel were temporarily removed from the plate and placed on a new plate for imaging using an in vivo imaging system (IVIS). Images of a representative well from each experimental group are shown. b, c Relative fluorescence curves (normalized to day 0) for hydrogels inclubated without or with esterase and their area under the curves (AUCs) (****P < 0.0001). d Experimental outline: Mice were injected with fluorescent dye-loaded hydrogel (4 µl) into the right hindpaw (RHP) on day −1. Arthritis was subsequently induced with two i.p. injections of 37.5 or 75 μl KBx/N serum on day 0 and day 2. Control animals received no serum. Every other day, animals were imaged using IVIS, arthritis severity was scored clinically, and paw swelling was measured with calipers. e, f Change in RHP thickness curves and their AUCs (*P < 0.05 and **P < 0.01). g IVIS images of a representative animal from each experimental group. h, i Relative fluorescence (normalized to day 0) measured over the RHP and AUCs (***P < 0.001 and ****P < 0.0001). Data in b, c are means ± SD of technical repeats (n = 6, experiment performed twice). P-values were determined using one-way Anova with Tukey’s post hoc analysis. Data in b, c are means ± SD of technical repeats (n = 6, experiment performed at least twice). Data in e, f and h, i are means ± SEM (n = 6 mice/group, experiment performed twice)

