Figure 7.
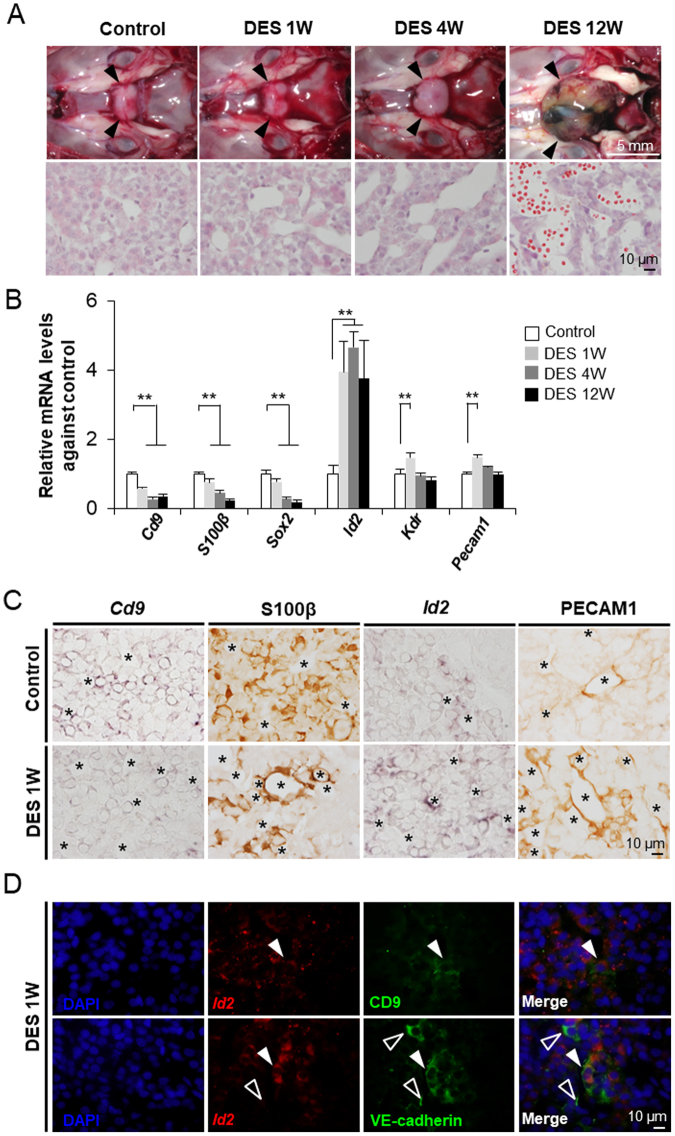
Change in the expression level of Cd9 in the anterior lobes of prolactinoma model rats. (A) The upper row shows images of the pituitary glands of control (Control) rats and those treated with DES for 1 (DES 1 W), 4 (DES 4 W), and 12 weeks (DES 12 W). The lower row shows HE staining of the pituitary glands of control (Control) and male rats treated with DES for 1 (DES 1 W), 4 (DES 4 W), and 12 weeks (DES 12 W). (B) Cd9, S100β, Sox2, Id2, Kdr, and Pecam1 mRNA levels after DES treatment as estimated by qPCR (mean ± SEM, n = 3), followed by normalisation with an internal control (Actb). **P < 0.01. (C) In situ hybridisation of Cd9 and Id2 and immunohistochemistry of S100β protein and PECAM1 in the anterior lobes of control (Control) and male rats treated with DES for 12 weeks (DES 12 W). Asterisks indicate blood capillaries. (D) Double-staining of Id2 via in situ hybridisation and CD9 or VE-cadherin via immunohistochemistry in the anterior lobes of male rats treated with DES for 1 week are shown in the upper and lower rows, respectively. White arrowheads indicate double-positive cells. Open white arrowheads indicate single-positive cells.

