Figure 4.
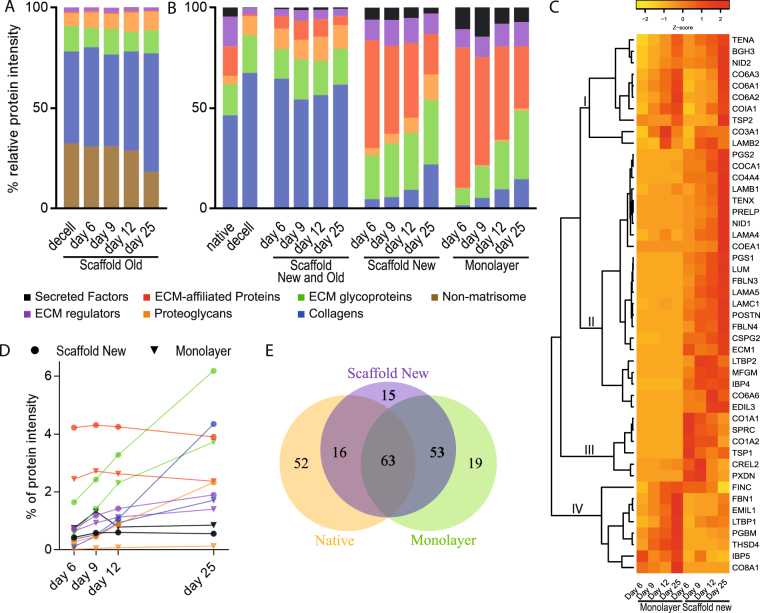
Fibroblasts repopulating tissue scaffolds modified the ECM and produced a different matrisome as compared to fibroblasts grown in monolayer culture. Cells were seeded on standard cell culture dishes or onto 3D scaffolds and cultured for up to 25 days followed by mass spectrometry analysis. (A) Relative contribution based on the summed protein intensities of individual matrisome groups from the original scaffold at different time points. (B) Relative MS-intensities for the six matrisome groups. First two bars show the native and decellularized lung tissue. The first set of four bars show the complete 3D tissue culture with both light and heavy signal (Scaffold Old and New). The two last sets of four bars show the newly synthesized matrisome proteins in the 3D scaffold cultures (Scaffold New) and the monolayer cultures respectively (Monolayer). (C) Heat map of core proteins for which protein intensities were registered at all four time points from either monolayer or 3D scaffold cultures, data scaled by row. Four sub clusters are marked in the figure, cluster I contains proteins with a similar abundance profile in monolayer and scaffold culture. II-III contains proteins abundant in 3D scaffold cultures but not in monolayer cultures. Cluster IV have proteins with a greater abundance in monolayer cultures. (D) Percentage of summed MS intensities of newly produced proteins subdivided into matrisome groups in scaffold and monolayer cultures over time. (E) Euler diagram comparing the number of matrisome proteins detected during tissue culture in the 3D scaffold compared to monolayer culture and native lung tissue.

