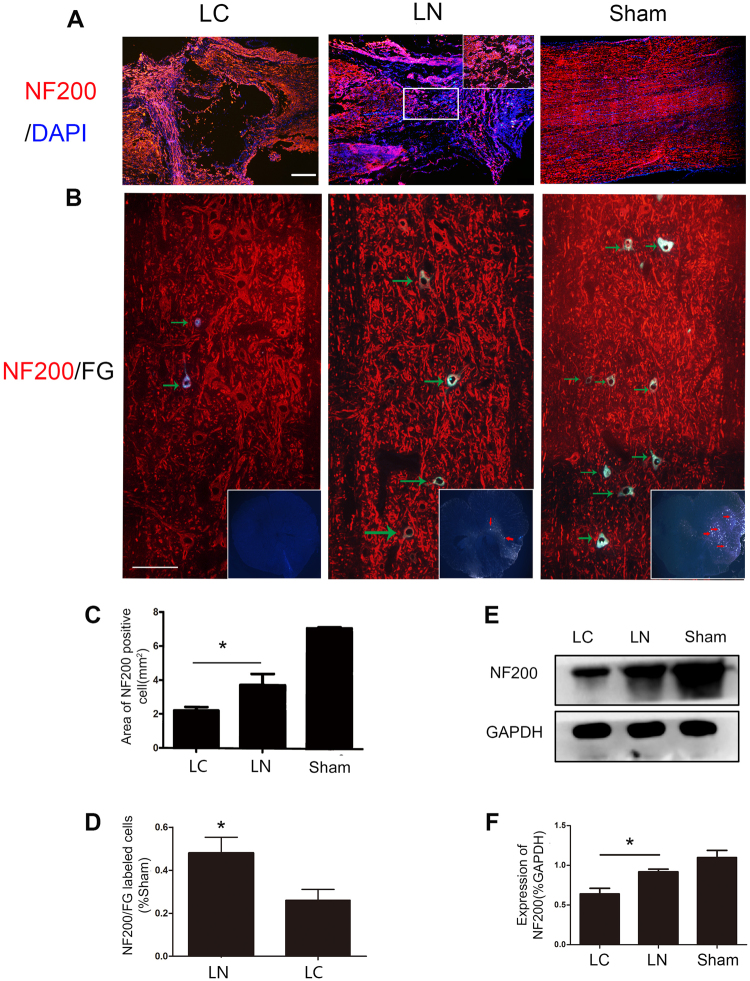
Figure 3.
Regeneration of nerve fibers. (A) Immunofluorescent staining of the neural fiber maker NF200 in each group. (B) Immunofluorescent presenting, in the T7 segment spinal cord, FG and NF200 labeled neurons (indicated by green arrow) at the sagittal section and FG labeled cell (indicated by red arrow) at cross-section. (C) Quantification of the area of NF200 positive axons. (D) Quantification analysis of the number of NF200 and FG labled cells in LN group compared with LC group. (E) Western blot analysis of NF200 expression in the injured spinal cord. (F) Quantification of Western blot for NF200 expression. Scale bare = 100 μm, *P < 0.05.

