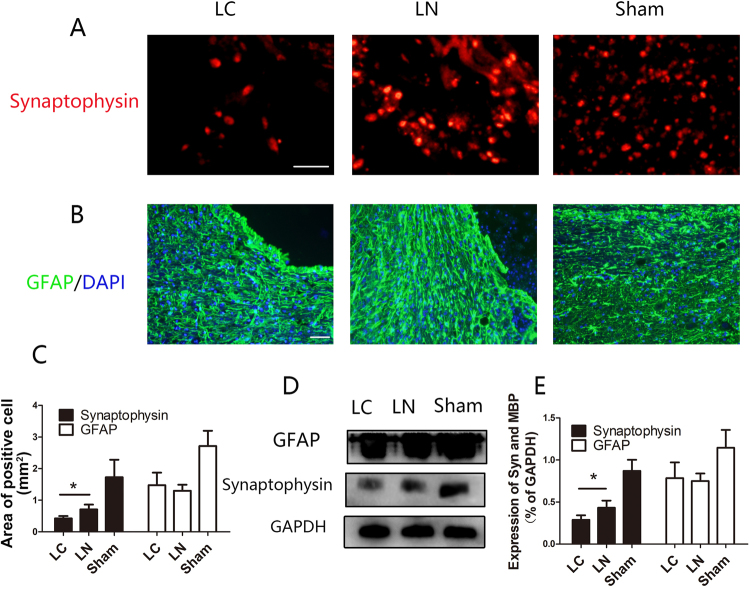
Figure 5.
Assessment of synaptic regeneration and astrocyte responses. (A) The synapse marker Synaptophysin was detected in injured areas of all samples. (B) Micrographs showing GFAP labeled astrocytes adjacent to the central cavity. (C) Quantification of Synaptophysin positive areas and GFAP positive cells. (D) Western blot analysis of Synaptophysin and GFAP protein expression levels. (E) Quantification of D. Scale bare = 50 μm, *P < 0.05.

