
Figure 2.
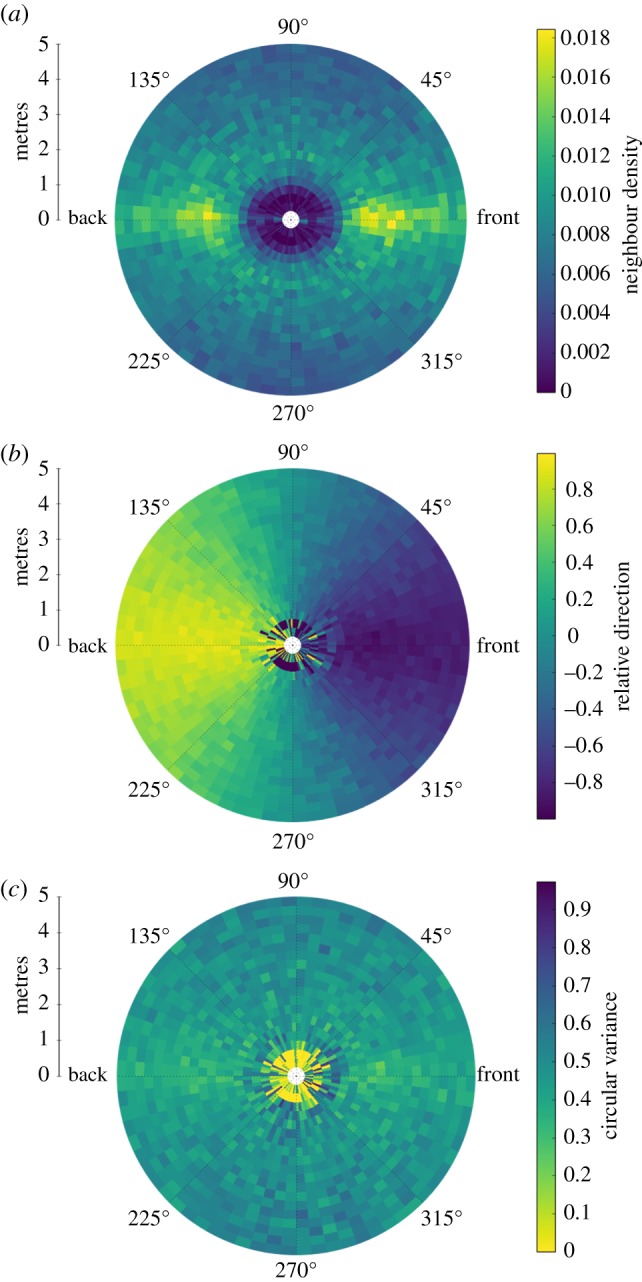
Fine-scale dynamics of wildebeest herds. Data are taken from UAV-borne video. (a) Spatial distribution of near-neighbours relative to a focal individual. Wildebeest display a well-defined inter-individual spacing with greater density to the front and rear of the focal individual. (b) Relative direction of neighbours. This is calculated as the dot product of neighbour heading vector with the vector towards the focal individual. Higher values indicate the neighbour is heading towards the focal individual, lower values mean the neighbour is moving away. (c) Circular variance in heading of near-neighbours. Variation in heading is greater either side of the focal individual. (Plots b and c effectively show the first and second moments, respectively, of the local distribution of neighbour headings.) Combined, these data suggest that wildebeest tend to align and follow each other in linear formations.