Figure 2.
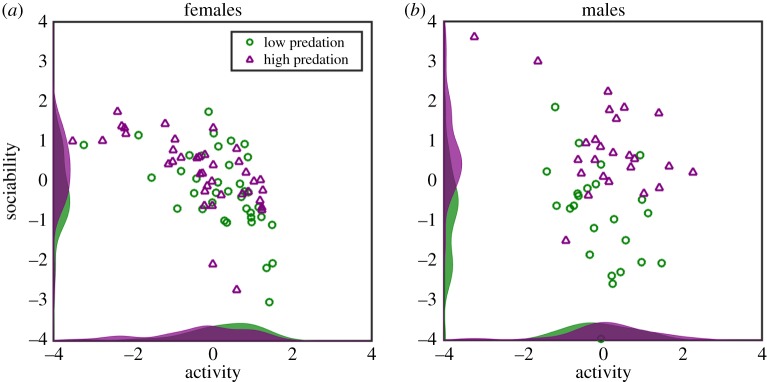
Groups in the Trinidad predation experiment plotted by the activity and sociability factors obtained in §3 using data from the 2nd to 10th min of trials, for (a) females and (b) males. Along each axis are kernel-smoothed distributions (Gaussian, bandwidth 0.4) of the data points for that factor. (Online version in colour.)

