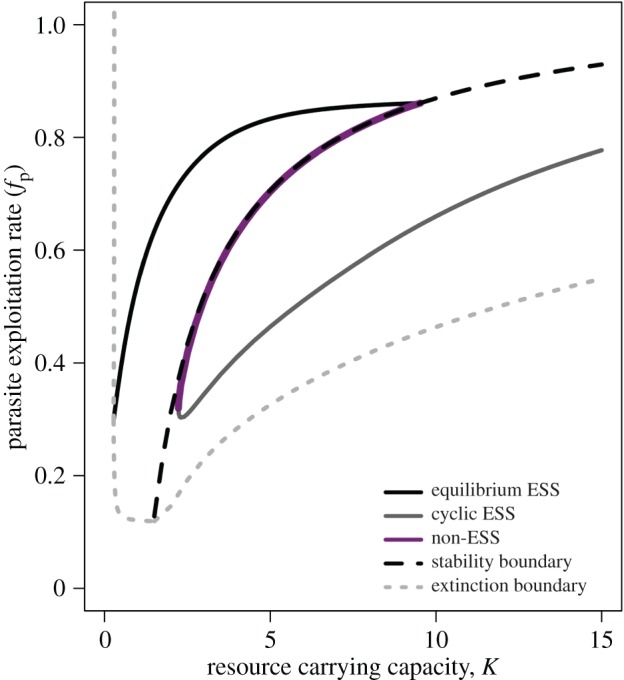
Figure 3.

Singular parasite exploitation rate (fP) strategies across a gradient in resource carrying capacity, K. The dotted grey line shows the parasite extinction boundary (for fP below this line, the parasite cannot invade the host-only system). The dashed black line shows the stability boundary (Hopf bifurcation; for fP above this line, the equilibrium of the system is stable). The solid black line shows the equilibrium population ES exploitation rates; the solid grey line shows the cyclic population ES exploitation rates that ‘ride the cycles’ of host density; the solid magenta line shows the non-ES singular strategies that are evolutionary repellors in this system—evolution will push the parasite population away from these strategies. The apparent overlap between the stability boundary and line of evolutionary repellors is coincidental—see electronic supplementary material, figure B2 for a case where these two lines do not overlap (here, the non-ES singular fP values are actually slightly smaller than the boundary fP values). (Online version in colour.)
