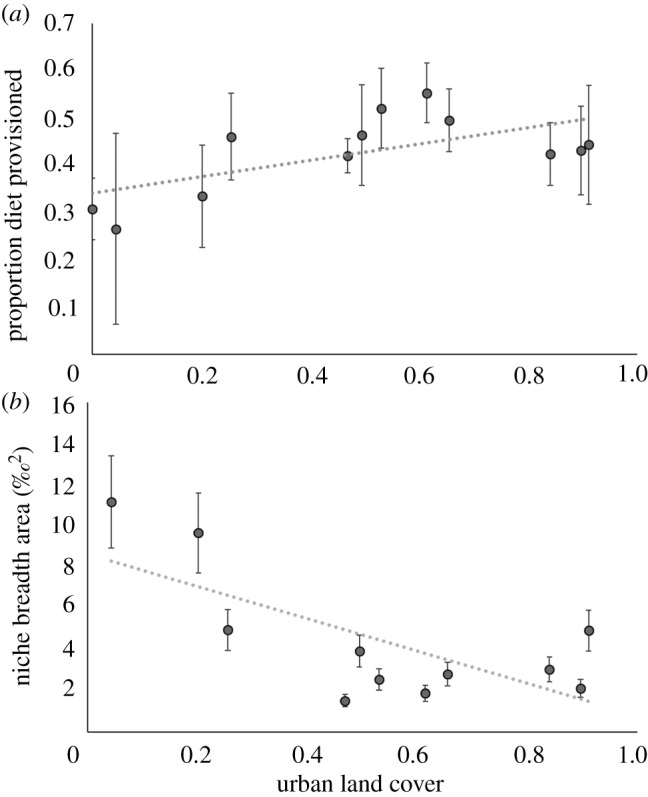
Figure 3.

Relationships between ibis diet and surrounding land cover at capture site. Circles indicate average values of each capture site for (a) proportion of ibis diet comprised of provisioned food, (b) isotopic area as a measure of niche breadth. Error bars show standard deviation. Urban land cover was calculated as a proportion of the 650 m buffer around capture sites (n = 12) using the Cooperative Land Cover (v. 3.2) dataset for the state of Florida.
