Figure 1.
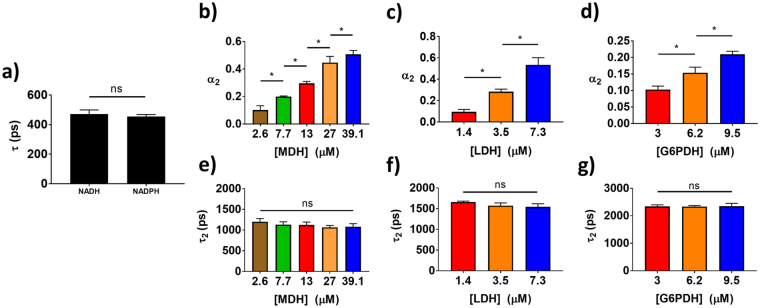
FLIM of NADH bound to metabolic enzymes in solution. (a) Mean and standard deviations of the fluorescence lifetime of 50 μM NADH and 50 μM NADPH from 3–5 experiments. ns = p > 0.05. (b,c) Mean and standard deviations of the fraction of protein-bound NADH, or , measured in mixtures of 50 μM NADH with varied concentrations of (b) MDH or (c) LDH across triplicate experiments. *p < 0.05. (d) Mean and standard deviations of NADPH measured in mixtures of 50 μM NADPH with varied concentrations of G6PDH across triplicate experiments. (e–g) Mean and standard deviations of the protein-bound lifetime of NAD(P)H, or , measured in the same solutions of NADH with MDH (e), NADH with LDH (f), and NADPH with G6PDH (g) across triplicate experiments.

