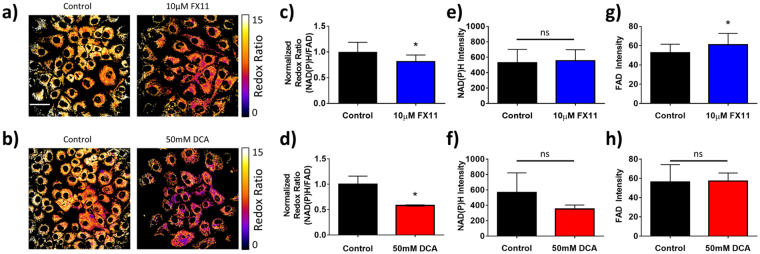
Figure 5.
Effects of FX11 and DCA on the optical redox ratio in MCF10A cells. (a–c) Representative images of MCF10A cells after 48 hours of 10 μM FX11 (a) and 48 hours of 50 mM DCA (b) treatment vs. vehicle, color-coded for the redox ratio. Scale bar = 50 μm. (c,d) Mean and standard deviations of the normalized redox ratio in MCF10A cells after 48 hours of 10 μM FX11 (c) and 48 hours of 50 mM DCA (d) treatment vs. vehicle. *p < 0.05 vs. control. n = 3 experiments. (e,f) Mean and standard deviations of NAD(P)H fluorescence intensity in MCF10A cells after 48 hours of 10 μM FX11 (e) and 48 hours of 50 mM DCA (f) treatment vs. vehicle. ns = p > 0.05 vs. control. n = 3 experiments. (g,h) Mean and standard deviations of FAD fluorescence intensity in MCF10A cells after 48 hours of 10 μM FX11 (g) and 48 hours of 50 mM DCA (h) treatment vs. vehicle. n = 3 experiments.

