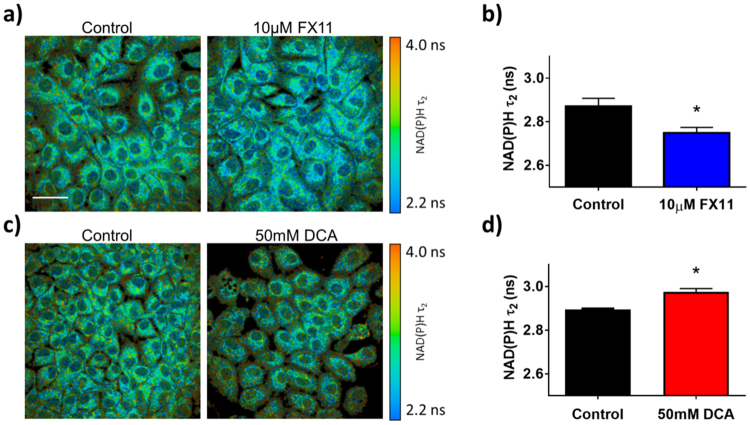
Figure 7.
Effects of FX11 and DCA on the fluorescence lifetime of protein-bound NAD(P)H in MCF10A cells. (a) Representative images of MCF10A cells after 48 hours of 10 μM FX11 treatment vs. vehicle, color-coded for NAD(P)H . Scale bar = 50 μm. (b) Mean and standard deviations of NAD(P)H in MCF10A cells after 48 hours of 10 μM FX11 treatment vs. vehicle. *p < 0.05 vs. control. n = 3 experiments. (c) Representative images of MCF10A cells after 48 hours of 50 mM DCA treatment vs. vehicle color-coded for NAD(P)H . (d) Mean and standard deviations of NAD(P)H in MCF10A cells after 48 hours of 50 mM DCA treatment vs. vehicle. n = 3 experiments.

