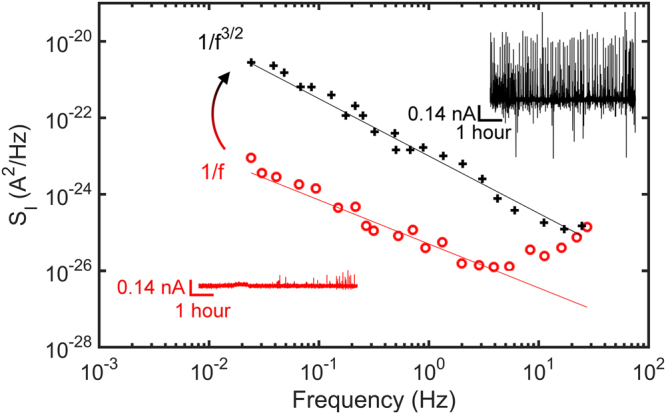
Figure 4.

Current noise spectra of diatoms. The spectral power density, SI, is presented as a function of frequency, f. The red and black current traces are reproduced from the recording presented in Fig. 2. The red trace shows the random weak and sporadic signals at the beginning, and the black trace the quasi-periodic signals of the end of the recording. The noise accordingly changes from 1/f flicker noise, to diffusion limited 1/f1.5 noise.
